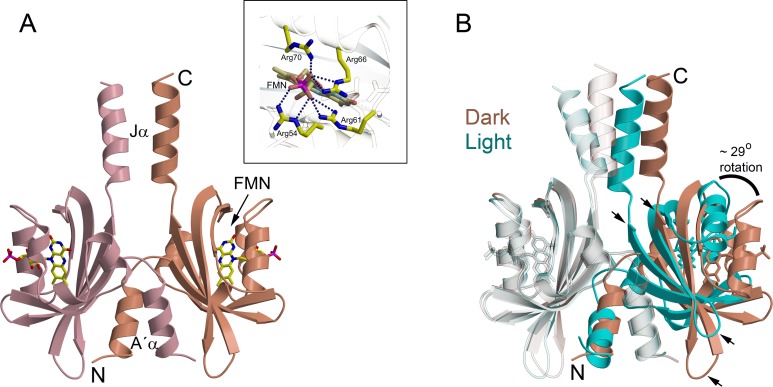
Fig 1. Ribbon representations of PpSB1-LOV dimer.
(A) dark state (PDB ID: 5J3W), the N and C termini of a single protein chain are labeled that shows intertwined N-terminus. Protein chains A and B are shown in pink and salmon colors, respectively. Each protein chain is bound to an FMN cofactor shown as stick models (colored by element: carbon, yellow; nitrogen, blue; oxygen, red; phosphorus, pink). The twofold axis runs from top to bottom. Inset to the figure shows the arginine cluster in FMN binding pocket of PpSB1-LOV where dotted lines represent the hydrogen bonds between the FMN and the arginine residues. (B) Superposition of dark (salmon, PDB ID: 5J3W) and light (cyan, PDB ID: 3SW1) states showing structural differences. The LOV core domains of protein chains shown on the left (transparent) were structurally aligned as described previously [28]. In order to superpose the second protein chain (shown on right), a (~ 29°) rotation and translation is required. Arrows indicate the rotation shifts between the respective secondary structure elements.

