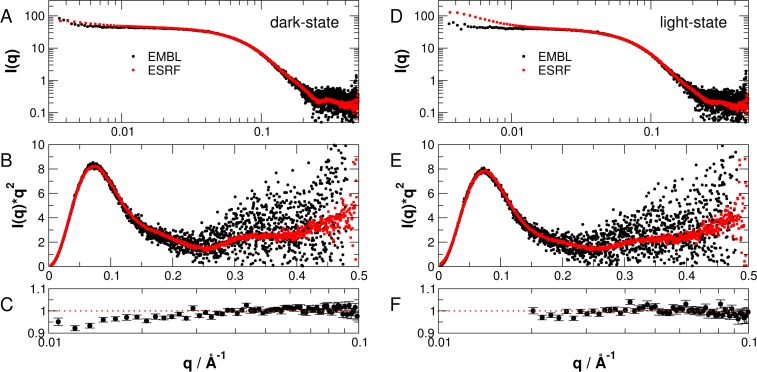
Fig 5.
Comparison of SAXS data of PpSB1-LOV-R66I in fully populated (A, B, C) dark-state and (D, E, F) light-state. Experimental SAXS data was recorded during two independent experiments on beamlines P12 at EMBL and BM29 at ESRF. (A, D) Log-log plots, (B, E) Kratky-plots of SAXS data. (C, F) SAXS intensities measured on P12 divided by intensities measured on BM29 in the low q-regions that have been used for further analysis.

