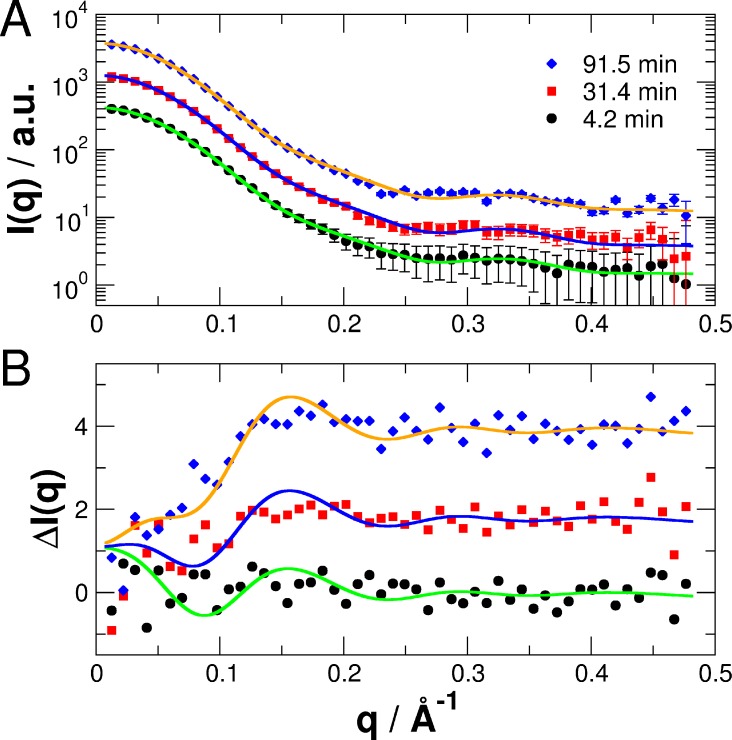
Fig 10. Structural transition from light- to dark-state in PpSB1-LOV-R66I followed by time-course SAXS.
(A) Experimental SAXS data measured at selected time-points. Solid lines are fits to the data assuming a two-state population of known PpSB1-LOV-R66I light- and dark-state structures based on the CORAL models with the only free fit parameter ϕ that represents the population of the light-state (Eq 1). Data and fits are shifted for clarity. (B) Difference SAXS patterns ΔI(q,t) of data measured for the time points shown in (A) minus the SAXS pattern recorded at t = 0 min. The solid lines are theoretical fits to the data as in (A) based on the CORAL models.

