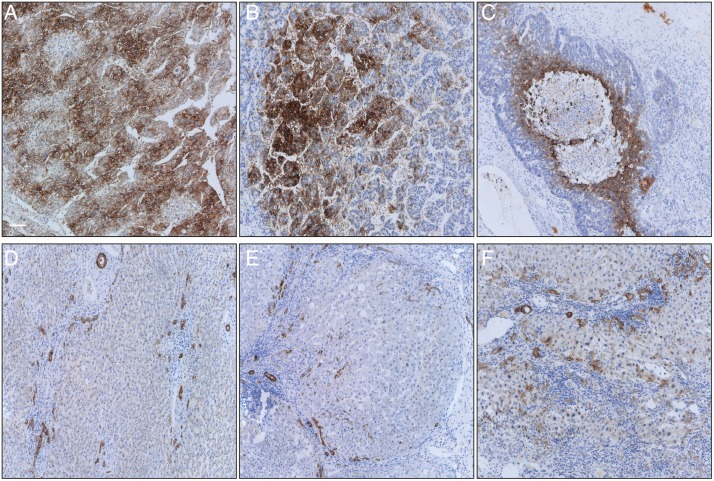
Fig 4. CA9 immunohistochemistry of HCC and cirrhosis samples.
Representative pictures (magnification 10x) of CA9 staining. White bar represents 100μm. A HCC of a patient with cryptic cirrhosis, CA9 score 4. B HCC of a patient with HCV cirrhosis, CA9 score 3. C HCC of a patient with ethanol induced cirrhosis and necrotic area, CA9 score 3. D Non-tumorous area in cryptic cirrhosis with ductular reactions. E Non-tumorous area in NASH cirrhosis with ductular reactions. F Non-tumorous area in ethanol induced cirrhosis with ductular reactions. The evaluation of the immunostainings was done according to the publication of Kang et al.[26], score 0: no expression, score 1: <5% weakly membranous staining, score 2: 5-<25%, score 3: 25-<50%, score 4: 50-<75%, score 5: >75% moderately to strongly membranous staining.

