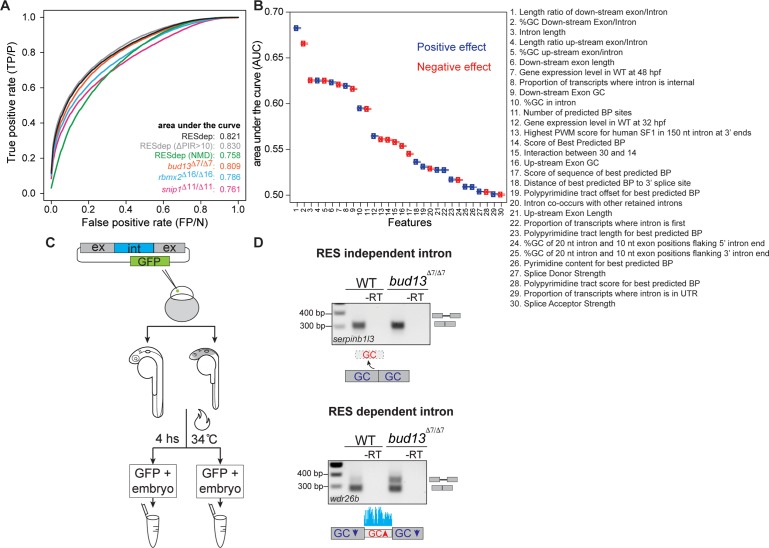
Fig 6. Logistic regression model can accurately classify RES-dependent and non-dependent introns.
(A) Classification performance of logistic regression models for different data sets of differentially retained vs. Ctr introns. ROC curves are averaged over 10,000 repeated holdout experiments where models have been trained with randomly sampled subsets of 90% (1,268) of the RESdep introns versus 1,268 Ctr introns with 30 features (S3 Table) and Lasso feature selection. Classification performance was estimated using the remaining 10% (141) RESdep introns and 141 randomly sampled Ctr introns. Having held fixed parameters, the same model was used to estimate classification performance with randomly sampled 141 introns from the other RES-dependent data sets, namely: (i) “RESdep (∆PIR>10)” introns from the “RESdep” set with ∆PIR > 10 in all three mutants (871 introns); (ii) “RESdep (NMD)”, introns from the “RESdep” set predicted to trigger NMD when retained (574 introns); (iii) “bud13∆7/∆7”, introns with ∆PIR>15 upon bud13 mutation at 32 hpf (2,363 introns); (iv) “rbmx2∆16/∆16”, introns with ∆PIR>15 upon rbmx2 mutation at 48 hpf (2,186 introns); and (v) “snip1∆11/∆11”, introns with ∆PIR>15 upon snip1 mutation at 48 hpf (2,675 introns). 95% confidence interval of reported average AUCs corresponds to AUC ± 0.001. (B) Capacity of each feature to discriminate between “RESdep” and “Ctr” introns, measured as AUC (average area under ROC curve) when used as the only feature in a one-feature logistic regression model. (C) Schematic of the experiment performed to validate the predicted features, see Material and Methods for details. (D) RES dependent but not RES independent intron was retained in bud13∆7/∆7 mutant as the regression model predicted. The validation experiment was done using two independent biological replicates (see S12A Fig).

