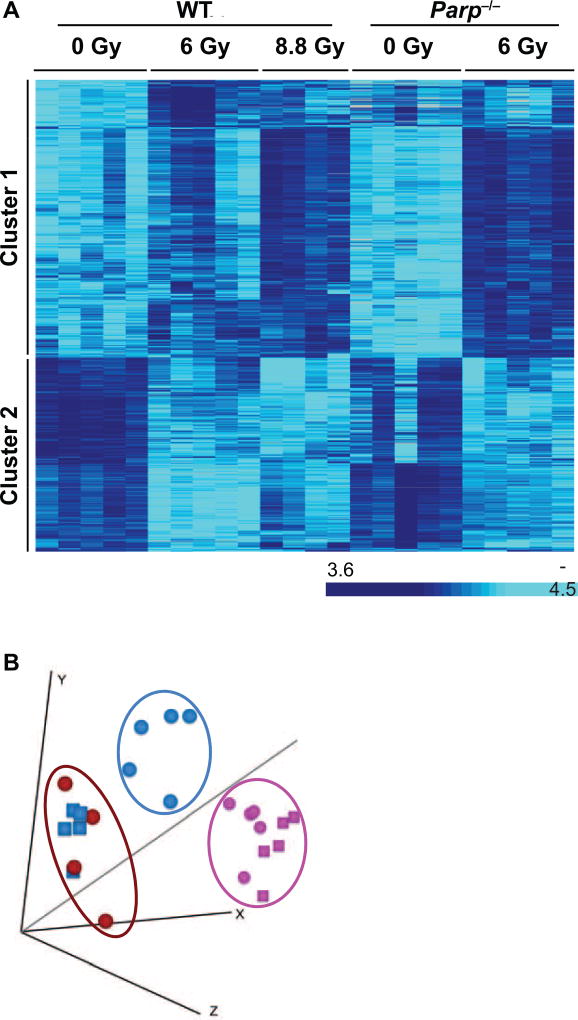
FIG. 1.
Panel A: Heatmap of the 3,009 genes (rows) differentially expressed in any of the dose-genotype combinations tested in this study. Each column represents an individual mouse. Relative expression level is indicated by color intensity according to the scale bar to the right. Clusters 1 and 2 represent up- and downregulated genes, respectively, 24 h postirradiation. No genes were identified that responded in opposite directions in WT and Parp1−/− mice. Panel B: MDS plot of the 3,009 differentially expressed genes. Each circle represents a sample from an individual WT mouse, each square a Parp1−/− mouse. The symbols are color coded by dose: pink (0 Gy controls), blue (6 Gy) and red (8.8 Gy). The distance between points on the plot represents the overall difference in expression of the 3,009 differentially expressed genes.

