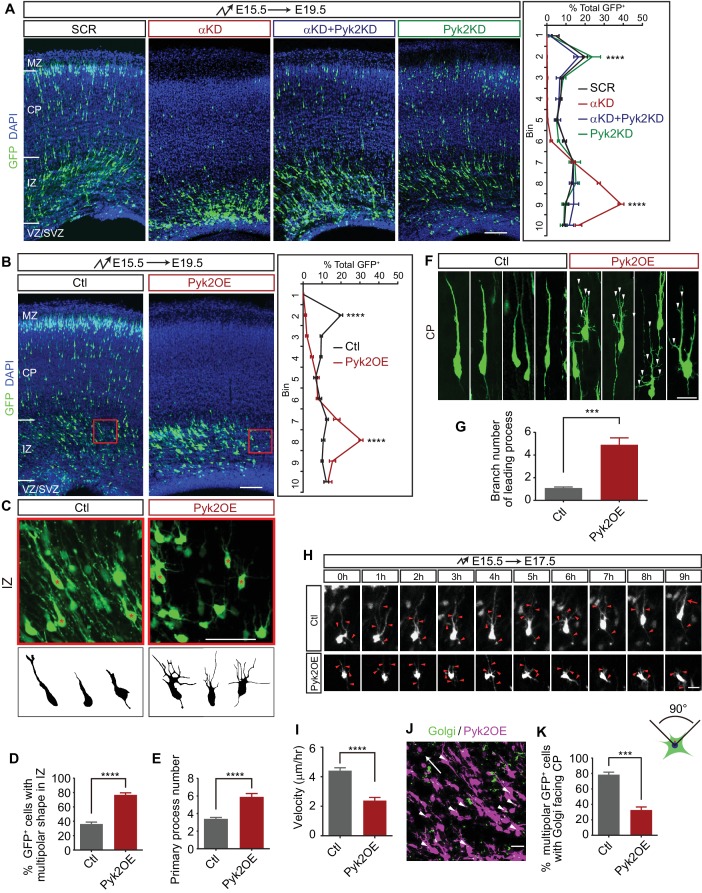
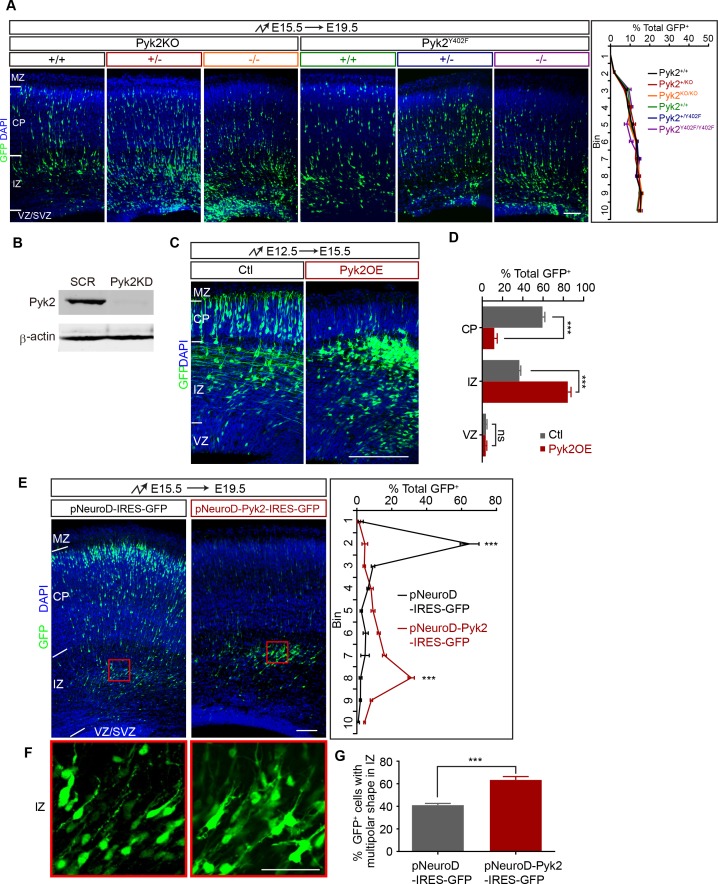
Figure 3. Pyk2 regulates cortical neuron migration.
(A) Cortical coronal sections of E19.5 embryonic brains electroporated at E15.5. Nuclei were counterstained with DAPI. Quantification of GFP+ cell distribution is shown on the right. n = 6 brains for each group. Statistical significance was assessed using one-way ANOVA, followed by a post hoc Tukey’s multiple comparisons test. (B) Cortical coronal sections of E19.5 embryonic brains electroporated at E15.5 with control or Pyk2-overexpressing (Pyk2OE) plasmids. Nuclei were counterstained with DAPI. Quantification of GFP+ cell distribution is shown on the right. n = 6 brains for each group. (C) High magnification of cortical neurons in the red boxes shown in (B). Lucida drawings are shown in the lower panels. (D) Percentage of GFP+ cells with multipolar morphology in IZ of control and Pyk2OE groups shown in (B). n = 6 brains for each group. (E) Primary process number per cell in IZ of control and Pyk2OE groups shown in (B). n = 10 cells for each group. (F) Typical cortical plate neuron morphology of control and Pyk2OE groups shown in (B). Arrowheads, aberrant branching leading processes. (G) Branch number of leading processes per cortical plate neuron of control and Pyk2OE groups shown in (F). n = 11 cells for each group. (H) Embryonic brains were electroporated in utero with control or Pyk2OE plasmids at E15.5. The organotypic slices are cut at E17.5. Representative frames from a 9 hr time-lapse are shown. Arrowheads, neurites; Arrow, leading process. See also Video 2. (I) Quantification of the migration velocity of control and Pyk2OE neurons. n = 19 cells for each group. (J) Golgi staining (green, arrowheads) of Pyk2OE neurons (magenta) in IZ at E19.5. Arrow indicates the orientation to CP. (K) Percentage of cells with Golgi facing the CP of control and Pyk2OE groups. n = 3 sections for each group. Data as mean ± SEM. Student’s t test for (B), (D), (E), (G), (I), (K); ***p<0.001; ****p<0.0001. See Figure 3—source data 1. Scale bar, 100 μm for (A, B); 50 μm for (C); 20 μm for all other panels. MZ, marginal zone; CP, cortical plate; IZ, intermediate zone; SVZ, subventricular zone; VZ, ventricular zone.


