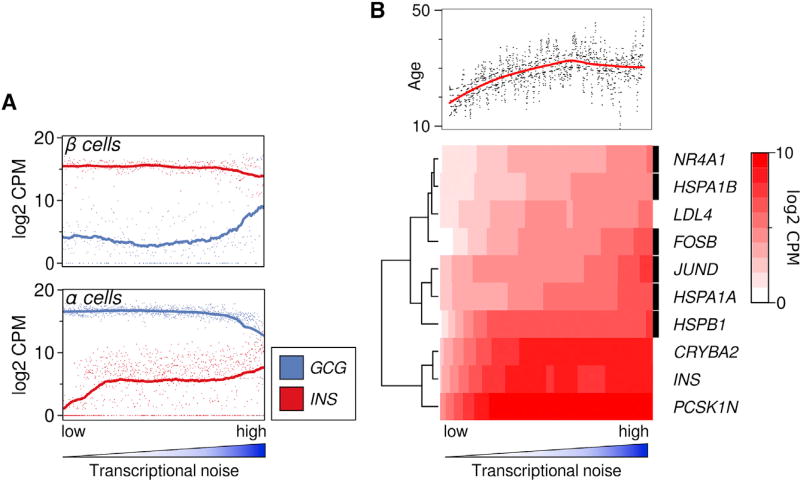
Figure 2. Gene Expression Changes Associated with Transcriptional Noise.
(A) Expression of cell-typical (INS for β-cells, GCG for α-cells) and non-typical hormone in cells, ranked by transcriptional noise. Dots represent individual cells, line is running mean, with k = n/5 (k = 69 for β cells and 199 for α cells).
(B) Organismal age and expression of stress-related genes are strongly associated with transcriptional noise. All genes were tested for association with transcriptional noise (linear rank regression), shown are the top genes by coefficient, with FDR <1E-3. Heatmap shows loess fit. Rows marked with a black box indicate genes that are associated with response to stress (Yu et al., 2015; Daugaard et al., 2007; Paneni et al., 2013; Toone et al., 2001).

