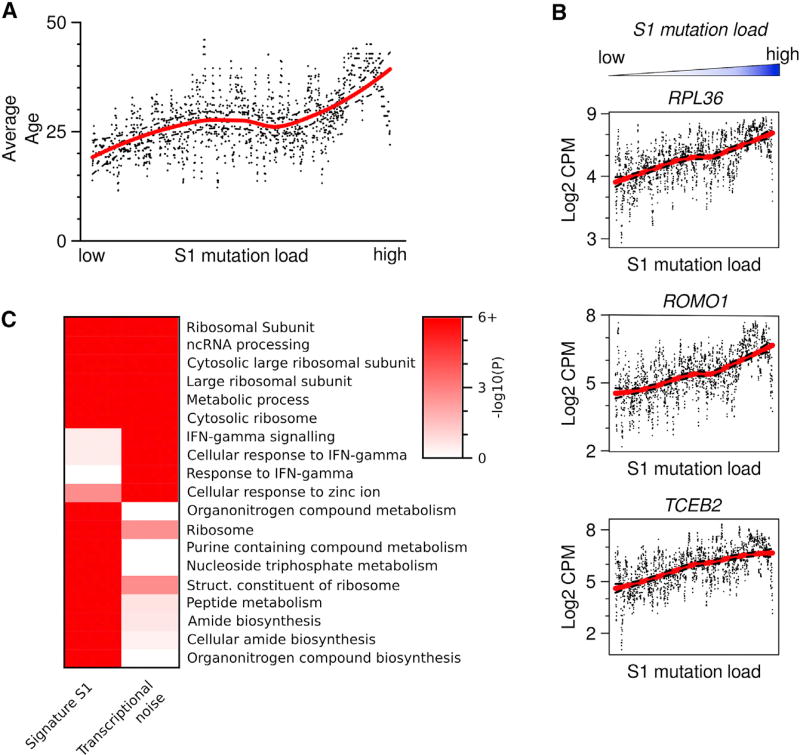
Figure 6. Transcriptional Correlates of Mutational Signatures.
Endocrine pancreas cells were ordered according to the fraction of mutations attributed to Signature S1.
(A) Average age is higher in cells with high S1 load (p = 5.95E-23, linear rank regression). Points are running mean, k = 10, and line is Loess fit, dotted lines indicate ± 0.999 confidence interval.
(B) Each gene was tested for association with signature S1 (linear rank regression), shown are the top genes by coefficient, with p < 1E-15 (FDR corrected). Points are individual mRNA measurements, line loess fit as in (A).
(C) Comparison of the top ten gene ontology (GO) categories positively correlated with signature S1 and transcriptional noise. Categories related to protein production, such as ribosomal proteins, recur in both. Color scale indicates FDR-adjusted p value, winsorized at 10−6.
See also Table S5.

