
Figure 1. Comparison of PLS Variable Importance for Projection (VIP) statistics.
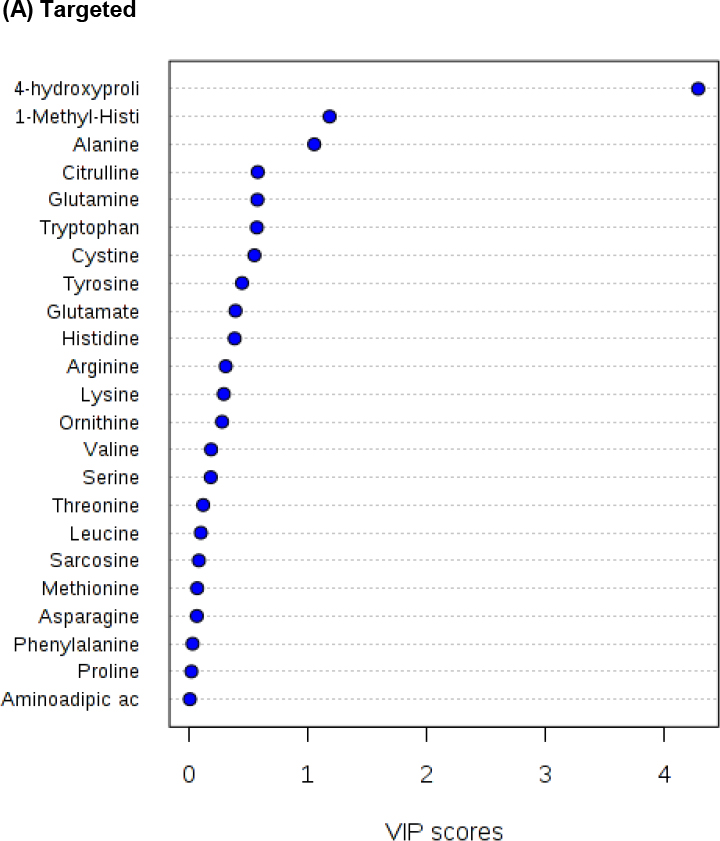
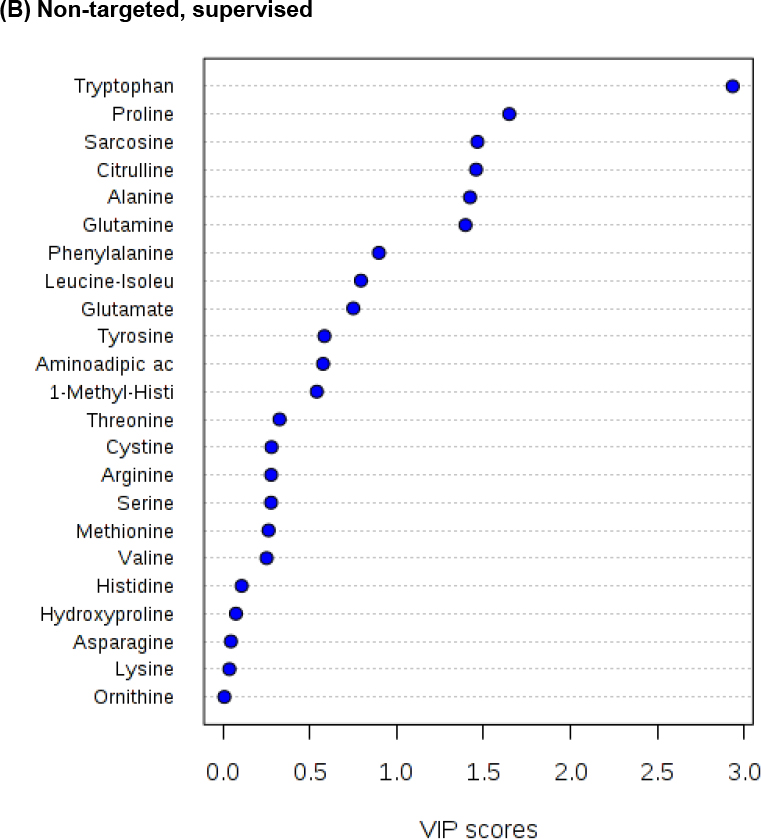

The VIP plot analyzes the contribution of each predictor by fitting the PLS model for both predictors and response, thus summarizing the contribution that each variable makes to the model [13]. A value of < 0.8 is considered small and makes the factor a candidate for deletion from the model [13]. The plots were generated using MetaboAnalyst 3.0 [10,11]. The PLS-DA analyses are compared in Supplementary Figure 2.