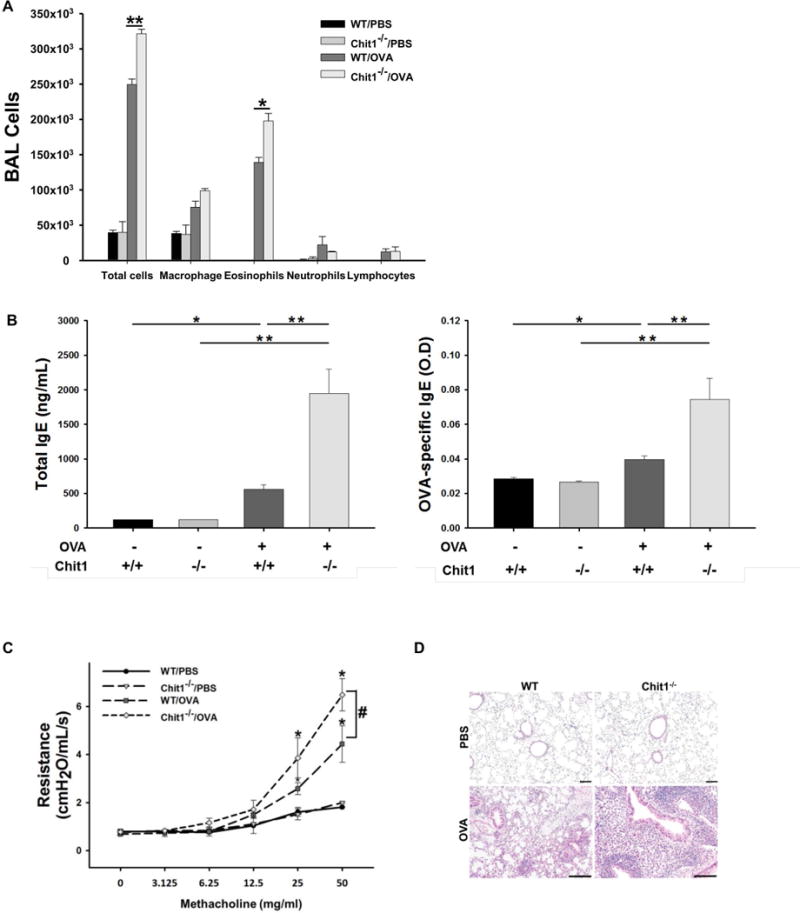
Figure 2. Role of Chit1 in allergen-induced airway inflammation and airway hyperresponsiveness.

WT and Chit1−/− mice were sensitized with OVA/Alum and challenged with OVA. (A) Total and differential cell counts in BAL fluid. (B) Serum levels of total and OVA-specific IgE measured by ELISA. (C) Airway resistance in response to inhaled methacholine in WT and Chit1−/− with and without OVA challenge was measured by Flexivent system. (D) Representative lung sections with H&E staining. Panel A is representative of two separate analysis. The values in panels A-C represent the triplicate evaluations in a minimum of 5 mice each group. Panel D is representative photograph of minimum 5 mice each group. *p<0.05, **p<0.01, #p<0.05 (WT/OVA vs. Chit1−/−/OVA). Scale bars in D, 50 and 100 μm, respectively.
