
Figure 4. Role of Chit1 in CD4+ T cell population in murine model of allergic asthma.
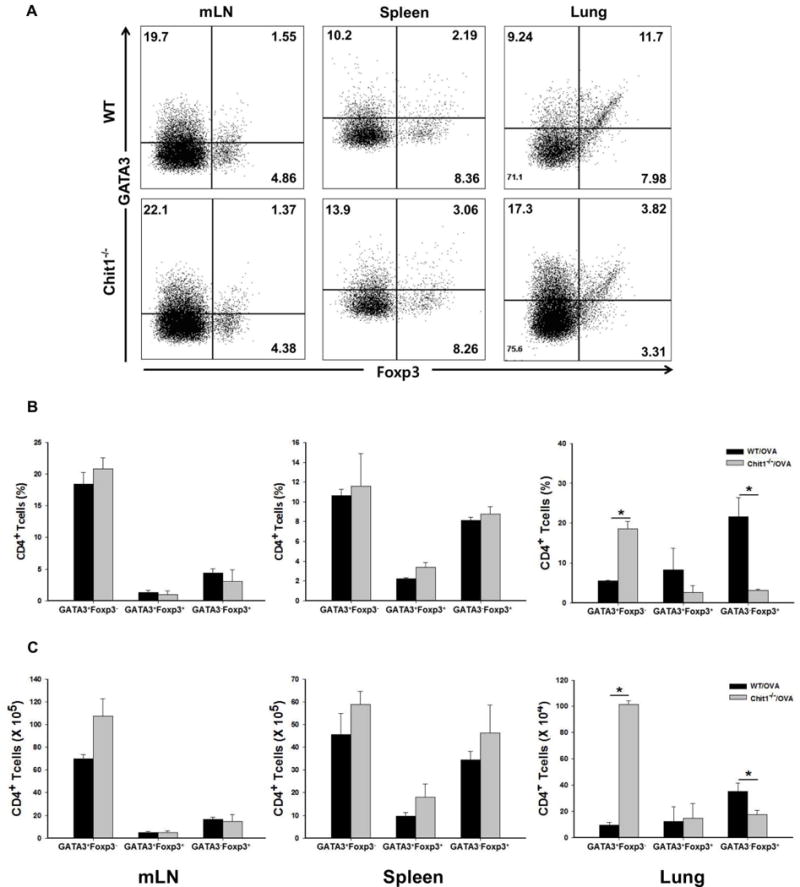
WT and Chit1−/− mice were sensitized with OVA/Alum and challenged with OVA. (A) 24 h after the last OVA challenge, cells were isolated from mediastinal lymph node (mLN), spleen and lung from WT and Chit1−/− mice, stained with anti-CD4, Foxp3, and GATA3, and analyzed by flow cytometry. (B) Bar graph represents percentage of CD4+GATA3+Foxp3-, CD4+GATA3+Foxp3+ and CD4+GATA3-Foxp3+ cells in the mLN, spleen and lungs from WT and Chit1−/− mice. (C) Graphs represent absolute numbers of CD4+GATA3+Foxp3-, CD4+GATA3+Foxp3+ and CD4+GATA3-Foxp3+ cells in the mLN, spleen and lungs from WT and Chit1−/− mice. Panel A is a representative FACS evaluations in a minimum of 5 mice each group. The values in panels B and C represent the mean±SEM of triplicate evaluations in a minimum of 5 mice each group. *p<0.05.