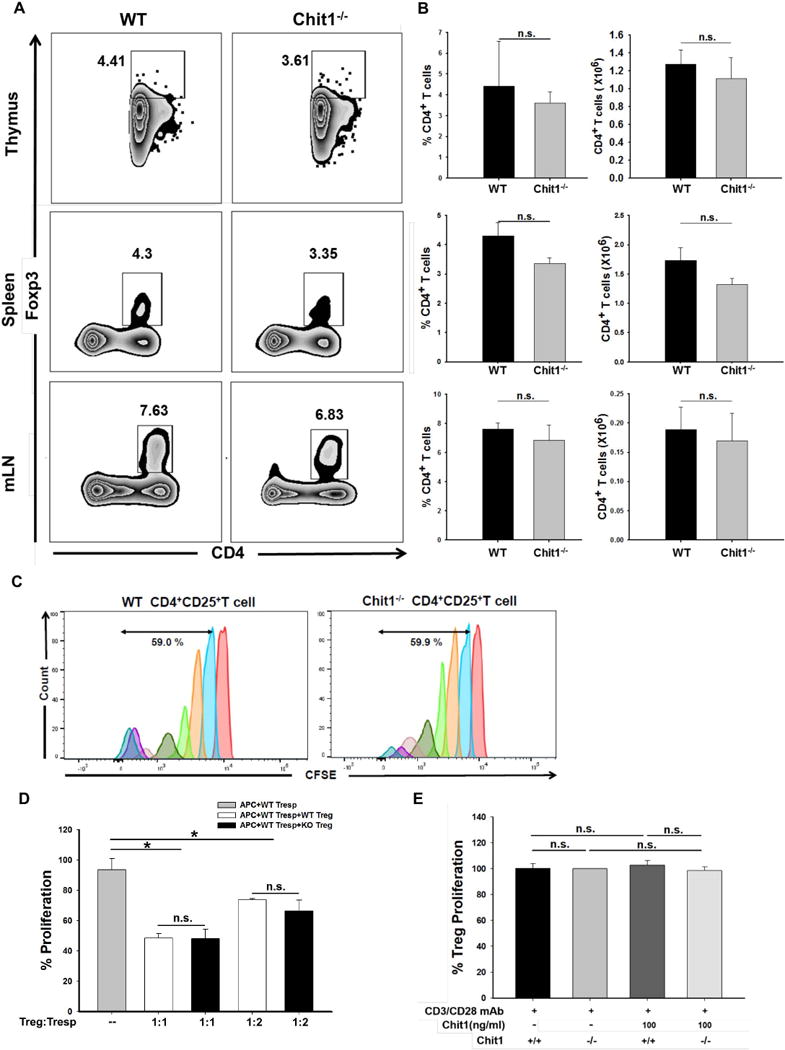
Figure 5. Role of Chit1 in the development, proliferation and functionality of regulatory T cells.

(A) Cells were isolated from thymus, spleen and mediastinal lymph node (mLN) from WT and Chit1−/− mice, stained with CD4 and Foxp3, and analyzed by flow cytometry (B) Bar graphs representing percentage and absolute numbers of CD4+Foxp3+ cells in the lungs from age- and sex-matched WT and Chit1−/− mice. (C) Regulatory T cell proliferation assay using carboxylfluorescein succinimidyl ester (CFSE) staining and FACS analysis. (D) Suppression of T cell-proliferative response by CD4+CD25+ T cells sorted from WT and Chit1−/− mice following co-culture with WT CD4+CD25- (Tresp) cells. (E) The proliferation of CD4+CD25+ Treg cell was measured by CCK-8. Isolated cells were stimulated with plate bound-anti CD3/CD28 in the presence of IL-2 with or without Chit1 following culture for 3 days. Panel A is a representative FACS evaluations in a minimum of 5 mice each group. The values in panel B represent the mean±SEM of FACS evaluations in a minimum of 5 mice each group. Panel C is a representative of CFSE evaluations in a minimum of 3 separate experiments. Panel D and E represent the mean±SEM of triplicate evaluations in a minimum of 2 separate experiments. *p<0.05, n.s.=not significant.
