Figure 1.
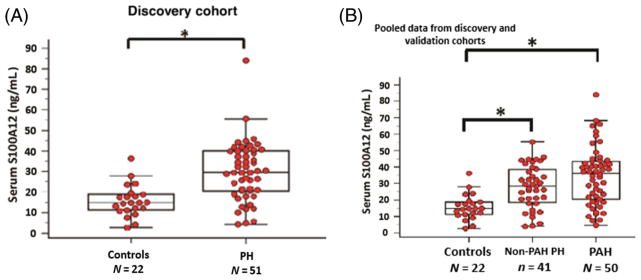
(A) Serum A100A12 protein concentrations in healthy normal controls versus PH patients in the discovery cohort. (B) Serum S100A12 protein concentrations in healthy normal controls versus non-PAH PH patients versus PAH patients in the combined data from both the discovery and validation cohorts. Data are presented as box-and-whisker plots, with horizontal bars representing medians, top whisker representing maximal expression, and bottom whisker representing the 5th percentile, Mann–Whitney U test, *P < 0.001. PAH, pulmonary arterial hypertension; PH, pulmonary hypertension.

