

Abstract
Improving fluorescent proteins through the use of directed evolution requires robust techniques for screening large libraries of genetic variants. Here we describe an effective and relatively low-cost system for screening libraries of fluorescent protein variants for improved photostability in the context of colonies on a Petri dish. Application of this system to the yellow fluorescent protein mCitrine, led to the development of Citrine2 with improved photostability and similar high fluorescent brightness. The photobleaching robot was constructed using a Lego Mindstorms Ev3 set and a xenon arc lamp, which together create even and high irradiance over an entire Petri dish through patterned illumination.
Graphical abstract

Introduction
The use of fluorescent proteins (FPs) for imaging cellular functions has revolutionized cellular biology and pushed the boundaries of what it is possible to observe in cells. For example, FPs have been engineered to be sensors for protein-protein interactions,1 second messengers,2 neurotransmitters,3 and membrane voltage changes.4 Even though FP tools now allow us to probe the inner workings of cells with unprecedented precision and specificity, there remains substantial room for improvement in their fundamental properties. Photostability, the ability for fluorescence to resist photobleaching during illumination, is one property where FPs generally lag behind alternative fluorophore technologies such as synthetic dyes and fluorescent nanoparticles.5
Although FP photobleaching is a ubiquitous phenomenon, the emerging message from previous mechanistic studies is that multiple mechanisms are involved and their relative importance may be FP-variant dependent. In Aequorea victoria green FP (avGFP) it has been noted that glutamate decarboxylation contributes to photobleaching, but this has not been reported in other FPs.6 For the enhanced green FP (EGFP), an improved variant of avGFP, photobleaching was linked to the presence of molecular oxygen, radicals, and singlet oxygen,7 whereas avGFP was found to be insensitive to the same species.8 A QM/MM simulation on GFP-like proteins predicted photo-induced chromophore decomposition in the presence of molecular oxygen.9 This photobleaching occurs by an excited chromophore undergoing an intersystem crossing into the excited triplet state which can react with oxygen, possibly requiring an additional excitation event, which results in damage to the chromophore.10 In the orange FPs mOrange and mOrange2 (derived from Discosoma sp. RFP), and the red FPs TagRFP and TagRFP-T (derived from Entacmaea quadricolor), oxygen-dependent photobleaching was also observed.11 This observation led to the creation of Kriek, a more photostable version of mCherry (another red FP derived from Discosoma sp.), by reducing oxygen’s access to the chromophore.12 In contrast, the protein mStable, another E. quadricolor derived red FP, shows increased photostability due to the oxidation of a cysteine residue that interacts with the chromophore. It is thought that this oxidation reduces the chance of a cis-trans isomerization of the chromophore, which can result in a bleached FP.13 Although a role for oxygen appears to be a theme common to most photobleaching mechanisms, and removing oxygen prior to illumination tends to cause a reduction in photobleaching, the absence of oxygen is not sufficient to prevent photobleaching.11,12
Quantitative measurements of FP photobleaching half-lives has been problematic as results from different labs are rarely in complete agreement.14 Photobleaching half-life depends on the wavelength and intensity of the excitation light, as well as a multitude of other factors. One approach involves suspending cell sized aqueous droplets containing FPs in oil and measuring the time to photobleach from 1 000 to 500 photons/s/molecule, where the light intensity is adjusted to achieve the initial 1 000 photons/s/molecule.15 This approach is designed to match how end users image FPs, where the illumination intensity gets scaled to acquire the optimal signal to noise and minimize bleaching. Such experiments have revealed a linear relationship between light intensity and photobleaching, on a log-log graph, such that higher intensities result in increased photobleaching.16 The slope of this relationship varies between FPs, from a low of 0.72 in mTagBFP2 and a high of 1.77 in tdTomato, such that the ranked order of FP photostabilities can change as a function of intensity.16
Most of the FPs used in research today are the result of directed evolution efforts to maximize intrinsic fluorescent brightness (a product of quantum yield and extinction coefficient). Higher intrinsic fluorescence brightness allows an FP to be imaged with better signal to noise ratio and allows a lower intensity of illumination to be used, which can allow longer imaging times.16 However, as quantum yields approach unity and extinction coefficients start to plateau, other characteristics must be used to improve FPs. Our approach is to increase the FP photon budget, the total number of photons that can be emitted by an FP before it photobleaches, by improving the photostability of the FP. Increased photostability means reducing the chance that a given absorption event will result in photobleaching. FPs with improved photostability will allow studies to be performed longer and with higher image acquisition rates.
In this work, we have used Integrated Photon Output (InPhO), as an alternative and convenient metric for assessing FP photostability and utility. An InPhO value is defined as the product of the integral of the photobleaching decay curve, normalized so that the initial value is 1, and the FP intrinsic fluorescent brightness. The InPhO value is proportional to the total number of photons that equal concentrations of FPs will produce until complete bleaching occurs. This differs from other similar measurements, like total photon count, as it is based on bulk solution measurements rather than averaged single FP measurements. As with essentially all measures of photostability, InPhO values can only be compared under identical illumination conditions.
In the absence of a mechanistic understanding of photobleaching that may suggest rationale approaches to improving photostability, empirical screening of large libraries of variants has led to the identification of FP variants with improved photostability.11,12,17–19 Two general approaches have been used to screen large libraries of variants for improved photostability. The first is microfluidic fluorescence activated cell sorting (FACS)-type systems in which the fluorescence from single cells is measured before and after illumination with high intensity light.12,20–23 The second is on-plate colony screening where a fluorescence image of an entire Petri dish of bacterial colonies is acquired after photobleaching, and the brightest colonies are manually picked.11,24
A major challenge with the on-plate colony screening approach is achieving enough illumination intensity to uniformly photobleach colonies over the large area (42 cm2) of a standard Petri dish. To address this challenge, we now report a screening system in which colonies on a Petri dish are photobleached using a beam of high intensity white light and a robot that systematically moves the plate to achieve even illumination. We have applied this system to the directed evolution of a yellow FP mCitrine for improved photostability. mCitrine is widely used as both a fusion tag and as a FRET acceptor. Despite mCitrine’s popularity, it, like all yellow FPs, is vulnerable to photobleaching – mCitrine has been reported to photobleach ten times faster than EGFP.16 For this reason, a bright and photostable yellow fluorescent protein is desirable.
Results
Robot-assisted plate bleach
For library screening on Petri dishes, it is desirable to have as even of photobleaching as possible so that all colonies receive the same dose of light. The photobleaching robot used is made from one Lego Mindstorms EV3 kit and common laboratory items. In the plate bleaching configuration, this system drives the rotation of a Petri dish in front of an unfiltered 300 W xenon arc lamp white light source, resulting in 3.5 W/cm2 at the position of the plate. The light source is initially offset from the center of the Petri dish by a distance equal to the radius of the illumination spot (7.5 mm). The robot then rotates the Petri dish rapidly in front of the light source tracing and retracing a circle around the center for a specific length of time (Fig. 1A and C). The robot then drives forward one step (3 mm) causing the light to trace a larger circle. Each circle is bleached for a period of time that is directly proportional to the circumference of the circle.
Fig. 1.

Robot-assisted photobleaching. (A) Schematic of the plate bleaching configuration. (B) Schematic of the tube bleaching configuration. (C) Overlapping circle protocol of the plate bleaching configuration. Red circle represents the edge of a Petri dish. Blue line shows the path of the center of the illumination spot. Inset table show the time required on each circle to achieve even irradiance. Each sequentially larger circle’s radius increases in size by 20% of the smallest circle’s diameter, which is determined by the illumination spot size. In the table, Time refers to relative duration spent on each circle. (D) Image of fluorescein Petri dish before photobleaching. (E) Image of fluorescein Petri dish after photobleaching. (F) Theoretical and observed photobleaching profiles. Blue represents theoretical photobleaching. Red is observed photobleaching.
As the illumination spot is relatively large, the innermost part of each circle being illuminated will receive higher irradiance and will bleach faster than the outermost part of each illuminated circle. To compensate for this, an overlapping circle protocol was developed, with each new circle increasing in size by 1/5th of the diameter of the illumination spot size (Fig. 1C).
To validate our photobleaching robot we both simulated and tested the bleaching on Petri dishes with fluorescein added to the solid media. The fluorescein-containing Petri dishes have a uniform photobleachable fluorescent surface. Bleaching a fluorescein Petri dish with the overlapping circle protocol, to an average of 58% fluorescence remaining, resulted in a smooth line profile, and a max-min difference of 17% with a 3% standard deviation (Fig. 1D-F). We simulated the bleaching protocol and determined that higher numbers of overlapping circles increases the evenness of the photobleaching. Lower numbers of circles result in an increasingly jagged sawtooth bleaching pattern (Fig. 1F, Fig. S1D). Smaller step sizes could improve the evenness of photobleaching, but the step size of 1/5th of the illumination spot size is the smallest size that the robot could accurately take. The greatest differences between the simulation and experimental bleaching of fluorescein-containing Petri dishes occurs near the center of the dish (Fig. 1F, Fig. S1D). We suspect that this difference is due to the illumination beam scattering and bleaching a small area surrounding the beam. While the scattering itself remains constant, the bleaching resulting from it is strongest at the center of the plate, where the scattering from the opposite sides of the circle overlap. Equation 1 is the general formula to determine the time required on each successively larger circle to create the most even bleaching pattern.
| Equation 1 |
Variable tx is the time spent on circle x, where x is the circle number, with the smallest radius circle being 0 and the next largest being 1, and so on. Variable ti is the time spent on the smallest circle, r is the radius of the smallest circle, and s is the step size which is the increase in circle radius from circle x to x+1.
Robot-assisted tube bleach configuration
The robotic system was designed to be modular such that the plate spinning motor used in the plate bleach could be used separately from the stepping motor. This was done to allow the system to be easily converted into a format that was suitable for photobleaching of cell lysates or purified FPs in PCR tubes. A PCR tube holder was made from plastic tip rack holders and glued to the outer edge of a Petri dish. This custom holder can attach to the spinning motor module and support 28 tubes. Attaching this holder to the spinning motor module, placing it in front of the light source, and turning on the motor to spin the holder, results in equal light intensity illumination of all 28 samples. Another motor was added to create a shutter to control the illumination time accurately. This setup is referred to as the tube bleach configuration (Fig. 1B).
Half-life determination
To determine photobleaching half-lives, bacterial protein extraction reagent (B-PER; Thermofisher)-extracted cell lysate containing the FP was diluted with H2O to have a peak absorbance of 0.1, and divided in 5 × 50 μL aliquots in PCR tubes. The first tube was not bleached, the second tube was placed into the holder and spun in front of the light source for a predetermined length of time, t. The third tube was added and bleached along with the second tube, again for time t, and so on, resulting in a series of tubes bleached for 0t, 1t, 2t, 3t, and 4t. The fluorescence intensity of these samples were then measured in a fluorescence plate reader (Tecan Safire2) and their photobleaching half-lives calculated. Under these conditions, FPs are expected to have photobleaching half-lives that will fall between 1 and 60 min. This tube bleach configuration allows seven sets of four tubes to be run simultaneously so that accurate comparisons can be made between all samples.
The tube bleach configuration was validated by running three sets of mCitrine and Citrine2, three times each. The resulting average error in half-life measurements within a single run of the tube bleach protocol was 0.7% and from three runs was 0.6% (Fig. s6). There was no meaningful difference in the percent error between the mCitrine and Citrine2 data sets despite the large difference in half-life.
To maximize the number of variants that could be assessed using this method during library screening, we used an end-point version of this tube bleach configuration to screen 28 samples simultaneously. The protocol is the same as described above except that rather than bleaching several samples to get a time course, a non-bleached sample was compared to a single sample bleached for time t. This protocol provides the percent fluorescence remaining value and can be used to calculate an approximate photobleaching half-life. The best variants from this screen were then measured again using the more accurate half-life determination method described above.
Concentration, the inner filter effect, and photostability
During initial experiments with the tube bleach configuration, the importance of diluting samples to an absorbance of 0.1 had not yet been recognized. These early experiments revealed that samples at higher concentrations (and higher absorbances) consistently had longer half-lives than samples with lower concentrations.
The apparent photostability of macroscopic samples is expected to increase with absorbance due to the inner filter effect. The inner filter effect describes the decrease of light intensity over distance as it passes through an absorbing sample.25 The part of the sample closest to the light source receives the full intensity of light, but it absorbs and scatters photons such that the light intensity exponentially decreases deeper into the sample. This effect also decreases the measured fluorescence intensity to the point that higher concentration samples can have a lower measured fluorescence than lower concentration samples.25 In the context of photostability measurements, the inner filter effect causes an exponential increase in the apparent photostability as the initial absorbance is increased. To further confound the issue, the light intensity has a supralinear correlation with photostability that varies between FP variants.16 To minimize the influence of the inner filter effect, the absorbance of the FP solution was consistently adjusted to 0.1 AU. At this absorbance and below, there is a roughly linear dependence of fluorescence intensity to absorbance. This starting condition results in more accurate photobleaching half-life measurements as the absorbance decreases during photobleaching.
The Citrine variants were extracted with B-PER to create cell lysate and then serially diluted with water and the entire series was bleached simultaneously (Fig. S2). The evolved Citrine variants all showed the strong dependence of photobleaching on absorbance, as predicted by the inner filter effect. Intriguingly, for mCitrine the trend was reversed resulting in increased photobleaching at higher absorbance.
Interestingly, using purified mCitrine, rather than mCitrine-containing B-PER cell lysate, flipped the trend giving photobleaching half-lives matching the mammalian cell study results. We tested several additives to purified protein to attempt to isolate the cause of the aberrant photobleaching pattern. ATP (2 mM),26,27 dATP (2 mM), NaCl (100 mM), NaI (100 mM), and B-PER (50% v/v) had negligible effects on the photobleaching half-life. FAD (0.6 mM) resulted in an increase in photostability but this was determined to be due to the inner filter effect resulting from the absorbance of the flavin. Adding cell lysate to the purified protein did decrease the photostability but the component or components responsible were not identified.
The take-away message from these experiments was that absorbance should be consistent between samples with a starting absorbance 0.1 AU or lower in order to get accurate photobleaching half-lives that can be compared. The absorbance of 0.1 AU was chosen to roughly match the intracellular concentration of FPs when expressed in mammalian HeLa cells using the strong CMV promoter (~10 μM).28,29
For the remainder of the text we will add a qualifier word to the different photostabilities and photobleaching values according to their preparation: lysate, for E. coli cell B-PER extract derived values; purified, for Ni-NTA purified values; and HeLa, for values derived from HeLa cell tests.
Improving the photostabiity of mCitrine
The FP mCitrine is the result of three distinct directed evolution and engineering efforts. The first was the conversion of avGFP30 into EYFP31, then came the engineering of Citrine32 from EYFP, and finally the engineering of monomeric mCitrine33 from Citrine. Through these 3 steps the avGFP gene acquired a total of eight mutations.
Starting from mCitrine, we performed iterative rounds directed protein evolution for improved photostability (Fig. 2). In each round, a library of gene variants was created by error prone PCR of the template gene. This gene library was then expressed in colonies of E. coli and subjected to the Robot-assisted plate bleach protocol. Following photobleaching, the colonies that retained the highest fluorescent brightness were picked, cultured, and further assessed using the Robot-assisted tube bleach configuration. The genes encoding the variants with the highest InPhO values were pooled and used as the template for the subsequent round of directed evolution.
Fig. 2.

Robot-assisted photobleaching screening. Clockwise from the middle left shows 0.) The initial plasmid. 1.) Plasmid library generation. 2.) Transformation of E. coli. 3.) Growth on a Petri dish. 4.) Plate bleach configuration bleaching. 5.) Selection and growth of brightest variants and followed by B-PER protein extraction. 6.) Bleaching using the tube bleach configuration. 7.) Determination of half-lives. 8.) Selection of new templates for the next round. 9.) Sequencing.
This procedure led to the introduction of nine additional mutations in the mCitrine template: S30T, M69T, Y145H, N149Y, V163A, K206Q, K214E, M218T, and D234G. We have designated this variant as Citrine2. The m was dropped with the loss of K206, the mutation that monomerized Citrine,32 and so Citrine2 is likely to dimerize at high concentrations. The intermediate variants and their specific mutations are listed in Table S1. With reference to the crystal structure of mCitrine (PDB ID: 1HUY),32 four mutations, M69T, Y145H, V163A, and M218T, are inward facing. M69T and Y145H are in the first shell of residues around the chromophore, while V163A and M218T are in the second shell of residues and in contact with first shell residues. N149Y is outward facing and with its backbone adjacent to the chromophore. K206Q is also outward facing and this position 206 is known to be important for dimerization. S30T is outward facing and close to the chromophore but out of direct interaction range. K214E is in the loop region between β-strands S10 and S11. D234G is in the unstructured region near the C-terminus (Fig. 3). Overall, the chromophore environment of Citrine2 was extensively modified relative to that of mCitrine. The absorbance and emission spectral peaks are blue-shifted to 509 nm (mCitrine, 513 nm) and 523 nm (mCitrine, 528 nm) respectively. The most substantial difference between mCitrine and Citrine2 is the large 8.9-fold improvement in lysate photostability (Table 1) (Fig. 4). The brightness of Citrine2 is essentially identical to that of mCitrine. There is a slight decrease in quantum yield from 0.74 in mCitrine to 0.70 in Citrine2. However, this decreased quantum yield is compensated for by an increase in extinction coefficient from 94 000 M−1cm−1 in mCitrine to 98 000 M−1cm−1 in Citrine2, resulting in essentially equivalent fluorescent brightness for the two proteins.
Fig. 3.

Modeled location of mutations in Citrine2 and spectra. (A) Location of mutations in Citrine2 modeled based on the crystal structure of mCitrine (PDB ID: 1HUY).32 (B) Normalized absorbance and emission spectra of mCitrine in black and Citrine2 in green. Dashed line is absorbance and solid line is emission. All spectra are normalized to their peak absorbance or emission.
Table 1.
Spectral properties of mCitrine variants
| Fluorescent Protein | λex (nm) | λem (nm) | Emaxb (M−1 cm−1) | ϕflc | Brightnessd | Fluorescence lifetime (ns) | Lysate photobleaching halflifee (min) | pKa/Hill[f] coefficient | InPhO fold improvement[g] |
|---|---|---|---|---|---|---|---|---|---|
| mCitrine | 513 | 527 | 94 000 | 0.74a | 66 | 3.6 | 3.3 | 5.3/0.6 | 1 |
| Citrine 1.7 | 506 | 524 | 78 000 | 0.53 | 39 | 2.6 | 19.1 | N.D. | 3.4 |
| Citrine 1.9 | 508 | 525 | 88 000 | 0.38 | 32 | 2.9 | 15.0 | N.D. | 2.2 |
| Citrine 1.10 | 509 | 524 | 106 000 | 0.7 | 71 | 2.8 | 23.7 | N.D. | 7.7 |
| Citrine 1.11 | 509 | 524 | 98 000 | 0.59 | 55 | 3.2 | 31.3 | N.D. | 7.9 |
| Citrine 2 | 509 | 522 | 98 000 | 0.7 | 65 | 3.3 | 29.8 | 5.9/0.5 | 8.9 |
Previously reported data.16
Emax is the peak extinction coefficient determined by alkali denaturation.
ϕfl is the fluorescence quantum yield.
Brightness is the product of E and ϕ/1000.
Lysate photobleaching half-life is the best fit half-life curve based on bleaching a 0.1 absorbance FP solution to half its maximum value using the robotic white light tube bleach configuration using B-PER extracted cell lysate for 4, 8, 12, and 16 minutes.
pKa is the pH at which the fluorescence is at half of its maximum value and the Hill coefficient is the cooperativity of the pKa of fluorescence.
InPhO fold improvement is InPhO value normalized to that of mCitrine, based on the lysate photobleaching and brightness values. N.D.: Not determined.
Fig. 4.
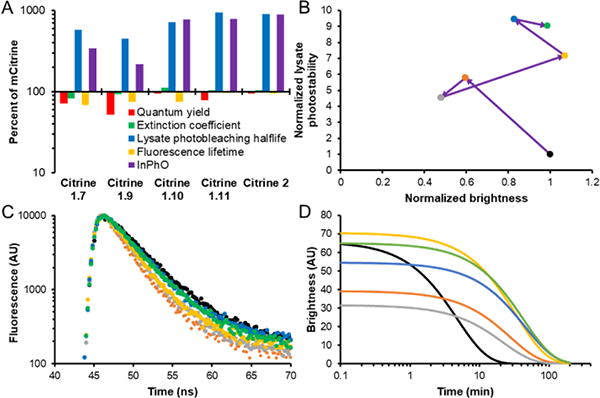
Evolution of in vitro photophysical properties. A) The percentage difference of each variant’s photophysical properties relative to mCitrine. B- D) Black is mCitrine, orange is Citrine 1.7, grey is Citrine 1.9, yellow is Citrine 1.10, blue is Citrine 1.11, and green is Citrine2. B) Lysate photostability and brightness changes during directed evolution of Citrine2. Purple arrows represent mutation events. Brightness and lysate photostability are normalized to the values for mCitrine. C) Fluorescence decay lifetime of the Citrine variants. D) Modelled photobleaching curve of equal concentrations of Citrine variants.
Environmental sensitivity
The effective pKa, based on fluorescence, increased slightly in Citrine2 compared to mCitrine, from 5.3 to 5.9. The Hill coefficient decreased from 0.60 for mCitrine to 0.51 for Citrine2. The Q69M mutation of mCitrine greatly decreased the sensitivity towards chloride anion.32,34 Despite the introduction of M69T in Citrine2, it remained relatively chloride insensitive with a fluorescence increase of 6% upon increasing the concentration of Cl− from 1 mM to 101 mM. mCitrine exhibited a 14% increase under the same conditions. Iodide was also tested at 1 mM to 101 mM. mCitrine and Citrine2 exhibited increases in fluorescence of 8% and 18% for mCitrine and Citrine2, respectively. To examine the effect of oxygen on lysate photobleaching rate, we added EC-Oxyrase to the PCR tubes when measuring the half-life in the tube bleach configuration. The reduction in dissolved oxygen concentration resulted in an increase in mCitrine’s photobleaching half-life from 3.3 to 4.0 min (a 21% increase). For Citrine2, the lysate photobleaching half-life increased from 29.8 to 35.2 (an 18% increase). Even after removal of dissolved oxygen, the photobleaching half-life mCitrine is 7.45-fold shorter than Citrine2 in the presence of dissolved oxygen.
Fluorescence lifetime
We determined the fluorescence lifetime of the best variants from each of the rounds of screening that led to Citrine2 (Table S2). In going from mCitrine (photobleaching half-life 3.3 min) to Citrine1.7 (photobleaching half-life 19.1 min), the fluorescence lifetime decreased from 3.6 ns to 2.6 ns. This trend, of decreasing lifetime as photobleaching half-life increases, has been previously described.12 However, variants beyond Citrine1.7 showed simultaneous increases in both lysate photobleaching half-life and the fluorescence lifetime. Citrine2 has a fluorescence lifetime of 3.3 ns and a lysate photobleaching half-life of 29.8 min. Comparing the lysate photostabilities and fluorescence lifetimes of the Citrine variants, there is no correlation (Pearson correlation: r = −0.25, p = 0.63). Though the sample size is small (n = 6), this result is not consistent with the expected inverse relationship between bleaching half-life and fluorescence lifetime (Fig. 4A and C).12
Mammalian cell bleaching
We tested mCitrine and Citrine2 in HeLa cells to determine how these FPs perform under typical live cell imaging conditions (Fig. 5). Under widefield illumination, the average HeLa photobleaching half-lives for mCitrine and Citrine2 are 34.18 and 59.63 s respectively, corresponding to an InPhO increase of 1.7-fold. Under confocal illumination, mCitrine and Citrine2 have average HeLa photobleaching half-lives of 2.57 and 5.34 s respectively, corresponding to an InPhO increase of 2.1-fold (Table S3, Fig. 6).
Fig. 5.

HeLa cell photobleaching with continuous illumination. Top images are mCitrine, bottom are Citrine2. From left to right the images are at 0s, 2s, 4s, 6s, and 8s. All are confocal images taken at the same settings, 488 nm, 50 mW illumination, and shown at the same scale.
Fig. 6.

Fluorescence decay in HeLa cells. A) Confocal fluorescence photobleaching mean decay curve, illuminated using a 50 mW, 491 nm pumped diode laser with a 540/30 nm emission filter (n=9). B) Confocal half-life of each measured HeLa cell, black line is the mean grey lines are the standard deviation. C) Widefield fluorescence photobleaching mean decay curve, 75 W xenon lamp illumination using 488/10 nm excitation and 525/25 nm emission filters (n=19). D) Widefield half-life of each measured HeLa cell, black line is the mean, and the grey lines are the standard deviation. In A and C the standard deviation is represented by light green flanking the dark green mean for Citrine 2 and the grey flanking the black for mCitrine. Half-lives are in Table S3.
Discussion
In this work, we have described a highly effective and versatile photobleaching system that represents a near-optimal compromise of a number of different considerations. For example, high intensity illumination causes faster photobleaching, but also rapidly heats the cells and results in reduced viability. The rotation of the Petri dish allows for additional air convection, and gives time for radiative cooling while the light is illuminating the other parts of the Petri dish. The impact of this cooling on cell viability was not quantified in this work. The use of white light, as compared to a specific wavelength or a small range of wavelengths, matches more closely with the current trends of multicolour imaging, as fluorescent proteins are often exposed to multiple illumination wavelengths, which can change the photobleaching rate.16,35
As our screening system is aimed at optimizing both brightness and photostability, we had to choose a scoring system for the characteristics that reflected our desired end point. For example, we needed to be able to decide whether losing 5% of the brightness to gain 5% on photostability half-life was worthwhile. InPhO is an unbiased comparison of equal concentrations of FPs that takes into account both brightness and photostability at a given illumination level. Mathematically, the InPhO value for photobleaching of a particular FP at a particular light intensity is described by Equation 2:
| Equation 2 |
where ε is the extinction coefficient, ɸ is the quantum yield, i is the identifier of each exponential required to describe the fluorescence decay due to photobleaching, α is the fraction of each exponential component, and is the half-life of each exponential component. Equation 2 simplifies to Equation 3 for monoexponential decays and to Equation 4 for biexponential decays.
| Equation 3 |
| Equation 4 |
During directed evolution to improve an FP, there is typically a trade-off between brightness and photostability. For example, TagRFP-T, mOrange2, and Kriek are three FPs specifically evolved for photostability.11,12 These FPs acquired 1, 4, and 3 amino acid substitutions from their parental variants, TagRFP, mOrange, and mCherry, respectively. All three variants gained photostability at the cost of brightness. Calculating their InPhO values reveals that TagRFP-T went up 2.3-fold, mOrange2 increased 14.7-fold, and Kriek decreased by 1.25-fold. In cases where the starting point has not previously been extensively optimized both brightness and photostability can potentially be increased.18,36 For example, the engineering of EBFP2 from BFP required 11 mutations and led to an overall increase in InPhO of 2190-fold, with both brightness (4-fold) and purified photostability (550-fold) improving greatly. In the current effort to improve the photostability of mCitrine, there was an initial increase in purified photostability at the expense of brightness. In later rounds the brightness was recovered with further photostability increases by acquiring several additional mutations. Overall, this process led to Citrine2 with an 8.9-fold InPhO improvement over mCitrine in E. coli cell lysate. In mammalian cell imaging experiments, Citrine2 proved to be more photostable and equally bright to mCitrine. The Citrine2 HeLa photobleaching half-lives observed both in confocal and widefield imaging are 1.74- and 2.08-fold better than mCitrine, respectively. The deviation of the InPhO fold-change between these two imaging modalities appears to be due to the different light intensities of illumination.16 This 2-fold improvement over mCitrine in HeLa cells is the source of the 2 in the name Citrine2. Interestingly, the quantum yield, extinction coefficient, fluorescence lifetime, and photostability all fluctuate during the rounds of directed evolution of Citrine2. Furthermore, Citrine2 is not optimal in any one individual photophysical parameter other than its InPhO value (Fig. 4).
Citrine2 maintains similar environmental sensitivity to mCitrine. In terms of pH sensitivity, Citrine2 has a higher pKa and a smaller Hill coefficient than mCitrine. As a result, Citrine2 ends up marginally more sensitive to pH than mCitrine but still bright across the physiologically relevant pH range of 5.5 to 7.5. Sensitivity to anions, such as chloride and iodide, was noted in precursors (i.e., EYFP) to mCitrine. At high concentrations, Cl− and I− caused minor increases of fluorescence for both mCitrine and Citrine2. This is in stark contrast to the 40% and 80% decreases in fluorescence seen in EYFP for both Cl− and I−, respectively, over the same concentration range.37 The Q69M mutation that abolished this sensitivity in Citrine was modified again to M69T in Citrine2. This supports the assertion of Griesbeck et al.32 that the halide sensitivity is abolished by repacking the protein interior to block a putative halide-binding cavity, rather than a specific interaction with the methionine (or threonine) side chain at position 69.
This previously observed inverse relationship between fluorescence lifetime and photostability12 is likely a result of starting directed evolution projects with an FP that has previously been highly optimized for brightness. In such a situation, most mutations that favor a different trait, such as photostability, will come at a cost to the brightness. If this loss of brightness is due to a decreased quantum yield, then the fluorescence lifetime will also decrease according to Equation 5:38
| Equation 5 |
where ɸ is the quantum yield, kr is the rate of radiative decay, and τ is the fluorescence lifetime. However, if evolution is continued for several rounds, the protein may evolve out of its local minimum and in to a new one that is associated with increases in both brightness and photostability. There is a wide range of fluorescence lifetimes, quantum yields, and photostabilities between all FPs derived from avGFP and a relatively small number of mutations differentiating them. Acquiring more than three or four mutations seems to be able to result in dramatically modified photophysical properties.
One possible mechanistic explanation for the improved photostability of Citrine2 relative to mCitrine, could be reduced accessibility of the chromophore to molecular oxygen. However, as mCitrine’s lysate photostability after EC-Oxyrase treatment is 7.5-fold lower than Citrine2 without EC-Oxyrase treatment, this does not seem to be the primary cause of the photostability enhancement. Rather, we speculate that the improved photostability is the result of a combination of factors. One factor could be diminished formation of reactive oxygen species by repacking of amino acid side chains around the chromophore. Another factor could be removing critical side chains that are potential targets for oxidation by reactive oxygen species. During two rounds of screening, the most photostable variant was one in which a methionine had been mutated to a threonine (mCitrine to Citrine1.7, M69T, and Citrine1.10 to Citrine 1.11, M218T). The thioether functionality of methionine is prone to oxidization.39 Both methionine residues are inward facing and M69T is adjacent to the chromophore. Suggesting that their potential oxidation could be a mechanism of photobleaching. Alternatively, the mutations may just be creating a chromophore environment that is tolerant to damage such that several oxidation events are required, on average, to quench or destroy the chromophore’s fluorescence.
The concentration dependence of photostability, caused by the inner filter effect, created a bias during screening for variants that expressed the FP at a higher concentration. All of the new variants appeared much brighter than mCitrine in colonies and in E. coli liquid culture due to higher expression. All of the variants also yielded higher protein concentrations after protein extraction suggesting that screening under this white light bleaching condition also puts selection pressure on protein expression along with photostability and brightness. As the on-plate screening cannot normalize the concentration in colonies, this strongly favors high expressing variants when concentration and photostability have a direct relationship. High protein concentration has been reported to effect FP photophysics and cause a decrease in brightness.40 However the total protein concentration in cell lysate is dilute compared to the protein concentrations additive required to observe these effects (50 mg/mL) with FPs.40
Conclusions
The robotic white light photostability screening system enables rapid and facile screening of a large number of variants on the basis of their photobleaching half-lives. This system was successfully applied to the creation of a bright and more photostable yellow FP designated as Citrine2. This new FP represents a useful new addition to the tool box of fluorescent proteins for live cell imaging.
Methods
Molecular cloning and mutagenesis
To create the libraries for photostability screening, EP-PCR was performed using Taq polymerase (New England Biolabs). 50 μL reactions were created using: 5 μL of 10× Taq buffer,2 μL of an NTP mix containing dATP (5 mM), dGTP (5 mM), dCTP (25 mM), and dTTP (25 mM), 4 μL MgSO4 (25 mM), 1.5 μL of each DNA primer (10 μM), 1 μL of template (~2 fmol), 1 μL of Taq, 0.5-1 μL MnCl2 (10 mM), and deionized H2O up to 50 μL. The MnCl2 was added last. Standard PCR were performed using Pfu polymerase and Q5 high fidelity polymerase (New England Biolabs) using their recommended protocols. DNA primers were purchased from IDT. All PCR products were run on 1% agarose gels with 1 μL of 10 mg/mL ethidium bromide. The relevant bands were visualized with UV light, cut out with a razor blade, and the DNA was extracted using gel extraction kits (Thermo Fisher Scientific or BioBasic) using the manufacturer’s recommended protocols.
Gibson Assembly (New England Biolabs) was used to assemble the pBAD His B plasmids (Thermo Fisher Scientific) for transformation. A reduced scale protocol was used with 1 μL vector, 1.5 μL of insert, and 2.5 μL of 2× Gibson Assembly Master Mix. This mix was then incubated for 4 hours at 50 °C and left at room temperature until needed for transformation, 0-48 hours. It was then diluted with 5 μL of deionized H2O before transformation. E. coli strain DH10B (Thermo Fisher Scientific) was then transformed with the resulting plasmids using electroporation.
To insert constructs into pcDNA3.1(+), the pBAD template containing the insert, and pcDNA3.1(+) vector were digested using FastDigest XhoI and HindIII (Thermo Fisher Scientific) in 1× FastDigest buffer for 15 min with no thermal inactivation, then run on an agarose gel and extracted, as described above. The insert and vector were combined in a 6:1 ratio and ligated using T4 ligase (Thermo Fisher Scientific) in 1× T4 ligase buffer for 15 min at room temperature.
The transformed cells containing the pBAD/His B plasmids were plated onto agar with LB medium and 0.4 mg/ml ampicillin and 0.02% w/v L-arabinose, and grown overnight at 37 °C. On-plate photostability colony screening was performed using illumination from a 300 W xenon arc lamp and a Lego Mindstorms EV3 robot in the plate bleach configuration. The arc lamp is placed 2 cm from the Petri dish gel surface, 3.5 W/cm2 of white light illumination, and aimed such that the light just touches the center point around which the Petri dish rotates, and on the center line such as the robot drives forward it will move directly away from the center of rotation. The robot needs to be aligned such that it will drive perpendicularly to the illumination such that the distance between the light source and the Petri dish does not change. Illumination intensity was determined using a LumaSpec 800 (Prior Scientific) light meter.
The brightest colonies after photobleaching were selected grown in LB and their cell lysate acquired through B-PER extraction. The B-PER extracted cell lysate was then diluted to an absorbance of 0.1 at peak absorbance, ~510 nm, with H2O and a 50 μL aliquot was photobleached using the 300 W xenon arc lamp, 3.5 W/cm2 of white light illumination, and a Lego Mindstorms EV3 robot for 10-20 min in the tube bleach configuration, described above. Both a photobleached and non-bleached control sample were measured to obtain the percentage of fluorescence remaining. Winners were selected using InPhO, first a rough two-point half-life was calculated from the percentage of fluorescence remaining and then a rough brightness value was calculated using the absorbance normalized fluorescence of the non-bleached sample. The variants with the highest InPhO went into the plasmid pool for the next round of EP-PCR as depicted in Fig. 2. In each round, an average of 5 000 colonies were screened, ~28 were picked for the InPhO screening, and the top 1-3 variants were used as the templates for the next round.
Protein purification and characterization
A single colony of E. coli, transformed with the pBAD/His B plasmid containing an mCitrine variant, was used to inoculate 4 mL LB supplemented with 0.1 mg/mL ampicillin. This culture was incubated at 37 °C in a shaker incubator (220 rpm) for 12 hours. The liquid culture was then added into 500 mL of LB with 0.1 mg/mL ampicillin and incubated for a further 4 hours. The inducer L-arabinose was added to a concentration of 0.02% and the culture was allowed to grow overnight at 30 °C in a shaker incubator (220 rpm). The cells were then centrifuged at 15 000 RCF for 10 min at 4 °C, the supernatant was discarded and the pellet resuspended in 25 mL of 1×TBS. The cells were then lysed using a cell disruptor (Constant System). The cell debris was removed by centrifugation at 15 000 RCF for 35 min at 4 °C. The protein was then purified using Ni-NTA agarose beads (MC Labs) according to the Native conditions protocol, and buffer exchanged with 1×TBS using a centrifugal filter unit with 10 000 MWCO (Amicon). The methods for determining extinction coefficient and quantum yields are included in the supporting information.
B-PER extraction of cell lysate
The brightest colonies after photobleaching were selected using a combination of visual inspection under 480-500 nm illumination with long pass filter goggles and digital fluorescence imaging using a 515-545 nm emission filter. Picked colonies were transferred to liquid cultures and grown in 2-6 mL LB and 0.1 mg/ml ampicillin and 0.02% w/v L-arabinose in a shaker at 240 rpm and 37 °C, for 16 hours. The liquid cultures were then spun down at 15 000 RCF for 2 min and the supernatant was poured off. Then 100 μL of B-PER (Thermo Fisher Scientific) was added and the samples were vortexed for 5-60 min. The resulting suspension was then spun down at 15 000 RCF for 2 min and the supernatant, B-PER extracted cell lysate, was collected and tested for fluorescence and absorbance in a fluorescence plate reader (Tecan Safire2). The pellet left after the B-PER extraction was used as the starting point for plasmid purification. Miniprep kits (Thermo Fisher Scientific and BioBasic) were used according to their respective standard protocols.
Environmental sensitivity
The pKa was determined in a series of pH buffers (pH 3 to 11) using the Carmody buffer system.41 For each protein solution, 2 μl was added to 50 μl of the desired pH buffer in a 396-well clear-bottomed plate (Thermo Fisher Scientific) and the fluorescence measured in a Tecan Safire2 plate reader. pKa values were extracted by fitting the data against a theoretical curve. Chloride and iodide sensitivity was determined by adding 2 μL of purified protein; the protein starts in 1×TBS, then 5 μl of 1M NaCl or 1M NaI, and then diluted with deionized H2O up to 50 μL. This was compared against the same solution omitting the NaCl or NaI.
The effect of oxygen on photobleaching was probed using EC-Oxyrase to catalyse the conversion of dissolved oxygen into water. 300 μL B-PER cell lysate diluted with H2O to a peak absorbance of 0.1, then 1.5 units of EC-Oxyrase were added in a closed 2 ml microcentrifuge tube. After 5 min the solution was aliquoted into PCR tubes and half-lives determined via the tube bleach protocol described above.
Photobleaching environmental sensitivity was tested by creating 100 μL solutions of: 1 absorbance unit of FP, at the FPs peak absorbance wavelength; 1×TBS; and one of ATP (2 mM), dATP (2 mM), NaCl (100 mM), NaI (100 mM), and B-PER (50% v/v), FAD (0.6 mM). A 50 μL aliquot of each solution was transferred into PCR tubes and was bleached for 20 min in the tube bleach configuration. These bleached samples were compared against the unbleached counterpart by testing for fluorescence in a fluorescence plate reader (Tecan Safire2).
Fluorescence lifetime
Fluorescence lifetimes were measured on a TimeMaster time-resolved spectrofluorimeter (Photon Technology International) that uses the stroboscopic optical boxcar technique.42 All lifetimes were determined in 1×TBS at protein concentrations of approximately 0.1 μM. A nitrogen dye laser at using Coumarin 500 (Exciton Inc.) was used to create the 500 nm excitation, and the emission monochromator was set to 530 nm with a slit width of ~1 nm. A time window of 40 ns to 100 ns was measured over 301 channels. Each channel was measured with 10 shots that were averaged. The time window was scanned 3 times and averaged again. Various ND filters were used to match the max photon counts for each sample. The IRF was determined using a dilute solution of LUDOX® (Sigma-Aldritch) with 500 nm excitation and emission.
HeLa cell imaging
HeLa cells were maintained in Dulbecco’s modified Eagle medium supplemented with 10% fetal bovine serum (Gibco), Penicillin-Streptomycin (Gibco), GlutaMAX (Gibco) at 37 °C with 5% CO2. Transient transfections of pcDNA3.1(+) expression plasmids were performed using Lipofectamine 2000 (ThermoFisher Scientific). HeLa cells were grown to 60-70% confluency on 35 mm glass bottom dishes and were transfected with 1 μg of plasmid DNA and 2 μL lipofectamine 2000 according to the manufacturer’s instructions. The cells were imaged 24 – 48 h after the transfection. Immediately prior to imaging, cells were washed twice with Hanks balanced salt solution and then 1 mL of 20 mM HEPES buffered HBSS was added. All imaging was performed at room temperature.
Epifluorescence/widefield cell imaging was performed with an inverted Eclipse Ti microscope (Nikon) equipped with QuantEM EMCCD camera (Photometrics) and driven by NIS-Elements AR software package (Nikon). Cells were imaged with a 60× oil objective lens (numerical aperture (NA) = 1.49). The fluorescence was detected by 525/25 nm emission and 488/10 nm excitation filters. The photobleaching was done with 75 W xenon lamp and was recorded for 3 min with 1 s intervals with a 30 ms exposure time.
Confocal imaging was performed with an IX-81 motorised microscope base equipped with a 50 mW 491 nm pumped iodide laser, a CSU10 spinning disk (Yokagawa), a confocal scan head, and C9100-13 EMCCD camera (Hamamatsu). Cells were imaged with 60× oil objective lens (NA = 1.42) and a 540/30 nm emission filter. The photobleaching was done with full laser power (50 mW) and was recorded for 1 min with 0.2 s intervals with an exposure time of 50 ms.
Fluorescein plates
The fluorescein Petri dishes, used for testing the amount of bleaching received across the plate, were made of 3.75 g of Agar placed into a 1 L Erlenmeyer flask with 500 mL of H2O. The solution was microwaved until all the agar had melted. Fluorescein was added to the hot agar until the solution had obvious green fluorescence (~1 μM). This was then poured to cover the bottom of each Petri dish with approximately equal amounts of the fluorescein agar solution then cooled before use.
Supplementary Material
Insight, Innovation and Integration.
Fluorescent proteins are powerful tools for imaging and understanding living organisms. As such, significant efforts have been made to engineer fluorescent protein tools with improved properties. One property that has proven to be particularly difficult to improve is the photostability of fluorescent proteins. There is currently no clear mechanistic explanation for photostability, limiting the success of rational design and forcing researchers to rely on random mutagenesis and screening. To assist with improving the photostability of fluorescent proteins, we have developed a robot-assisted system for screening libraries of fluorescent protein variants for improve photostability in the context of colonies on Petri dishes. Using this system, we developed Citrine2 with double the photostability, and equivalent brightness, compared to the starting template, mCitrine.
Acknowledgments
Work in the Campbell lab is supported by grants from CIHR (MOP-123514), NSERC (RGPIN 288338-2010), Brain Canada, and NIH (U01 NS094246 and UO1 NS090565). MDW and FH were supported, in part, by scholarships from the University of Alberta.
Footnotes
Footnotes relating to the title and/or authors should appear here.
Electronic Supplementary Information (ESI) available: [details of any supplementary information available should be included here].
Notes and references
- 1.Cabantous S, Terwilliger TC, Waldo GS. Nat Biotechnol. 2005;23:102–107. doi: 10.1038/nbt1044. [DOI] [PubMed] [Google Scholar]
- 2.Chen TW, Wardill TJ, Sun Y, Pulver SR, Renninger SL, Baohan A, Schreiter ER, Kerr RA, Orger MB, Jayaraman V, Looger LL, Svoboda K, Kim DS. Nature. 2013;499:295–300. doi: 10.1038/nature12354. [DOI] [PMC free article] [PubMed] [Google Scholar]
- 3.Marvin JS, Borghuis BG, Tian L, Cichon J, Harnett MT, Akerboom J, Gordus A, Renninger SL, Chen T, Bargmann CI, Orger MB, Schreiter ER, Demb JB, Gan W, Hires SA, Looger LL. Nat Methods. 2013;10:162–170. doi: 10.1038/nmeth.2333. [DOI] [PMC free article] [PubMed] [Google Scholar]
- 4.Abdelfattah AS, Farhi SL, Zhao Y, Brinks D, Zou P, Ruangkittisakul A, Platisa J, Pieribone VA, Ballanyi K, Cohen AE, Campbell RE. J Neurosci. 2016;36:2458–72. doi: 10.1523/JNEUROSCI.3484-15.2016. [DOI] [PMC free article] [PubMed] [Google Scholar]
- 5.Martin-Fernandez ML, Clarke DT. Int J Mol Sci. 2012;13:14742–14765. doi: 10.3390/ijms131114742. [DOI] [PMC free article] [PubMed] [Google Scholar]
- 6.van Thor JJ, Gensch T, Hellingwerf KJ, Johnson LN. Nat Struct Biol. 2002;9:37–41. doi: 10.1038/nsb739. [DOI] [PubMed] [Google Scholar]
- 7.Greenbaum L, Rothmann C, Lavie R. Biol Chem. 2000;381:1251–1258. doi: 10.1515/BC.2000.153. [DOI] [PubMed] [Google Scholar]
- 8.Swaminathan R, Hoang CP, Verkman AS. Biophys J. 1997;72:1900–7. doi: 10.1016/S0006-3495(97)78835-0. [DOI] [PMC free article] [PubMed] [Google Scholar]
- 9.Grigorenko BL, Nemukhin AV, Polyakov IV, Khrenova MG, Krylov AI. J Phys Chem B. 2015;119:5444–5452. doi: 10.1021/acs.jpcb.5b02271. [DOI] [PubMed] [Google Scholar]
- 10.Donnert G, Eggeling C, Hell SW. Nat Methods. 2007;4:81–86. doi: 10.1038/nmeth986. [DOI] [PubMed] [Google Scholar]
- 11.Shaner NC, Lin MZ, McKeown MR, Steinbach PA, Hazelwood KL, Davidson MW, Tsien RY. Nat Methods. 2008;5:545–551. doi: 10.1038/nmeth.1209. [DOI] [PMC free article] [PubMed] [Google Scholar]
- 12.Dean KM, Lubbeck JL, Davis LM, Regmi CK, Chapagain PP, Gerstman BS, Jimenez R, Palmer AE. Integr Biol. 2015;7:263–73. doi: 10.1039/c4ib00251b. [DOI] [PMC free article] [PubMed] [Google Scholar]
- 13.Ren H, Yang B, Ma C, Hu YS, Wang PG, Wang L. ACS Chem Biol. 2016;11:2679–2684. doi: 10.1021/acschembio.6b00579. [DOI] [PMC free article] [PubMed] [Google Scholar]
- 14.Shaner NC, Steinbach PA, Tsien RY. Nat Methods. 2005;2:905–909. doi: 10.1038/nmeth819. [DOI] [PubMed] [Google Scholar]
- 15.Shaner NC, Campbell RE, Steinbach PA, Giepmans BNG, Palmer AE, Tsien RY. Nat Biotechnol. 2004;22:1567–72. doi: 10.1038/nbt1037. [DOI] [PubMed] [Google Scholar]
- 16.Cranfill PJ, Sell BR, Baird MA, Allen JR, Lavagnino Z, de Gruiter HM, Kremers GJ, Davidson MW, Ustione A, Piston DW. Nat Methods. 2016:1–7. doi: 10.1038/nmeth.3891. [DOI] [PMC free article] [PubMed] [Google Scholar]
- 17.Mena MA, Treynor TP, Mayo SL, Daugherty PS. Nat Biotechnol. 2006;24:1569–1571. doi: 10.1038/nbt1264. [DOI] [PubMed] [Google Scholar]
- 18.Ai HW, Shaner NC, Cheng Z, Tsien RY, Campbell RE. Biochemistry. 2007;46:5904–5910. doi: 10.1021/bi700199g. [DOI] [PubMed] [Google Scholar]
- 19.Bajar BT, Lam AJ, Badiee RK, Oh YH, Chu J, Zhou XX, Kim N, Kim BB, Chung M, Yablonovitch AL, Cruz BF, Kulalert K, Tao JJ, Meyer T, Su XD, Lin MZ. Nat Methods. 2016;13 doi: 10.1038/nmeth.4045. [DOI] [PMC free article] [PubMed] [Google Scholar]
- 20.Zhao Y, Abdelfattah AS, Zhao Y, Ruangkittisakul A, Ballanyi K, Campbell RE, Harrison DJ. Integr Biol. 2014;6:714–25. doi: 10.1039/c4ib00039k. [DOI] [PubMed] [Google Scholar]
- 21.Davis LM, Lubbeck JL, Dean KM, Palmer AE, Jimenez R. Lab Chip. 2013;13:2320. doi: 10.1039/c3lc50191d. [DOI] [PMC free article] [PubMed] [Google Scholar]
- 22.Lubbeck JL, Dean KM, Ma H, Palmer AE, Jimenez R. Anal Chem. 2012;84:3929–3937. doi: 10.1021/ac202825z. [DOI] [PMC free article] [PubMed] [Google Scholar]
- 23.Cormack BP, Valdivia RH, Falkow S. Gene. 1996;173:33–38. doi: 10.1016/0378-1119(95)00685-0. [DOI] [PubMed] [Google Scholar]
- 24.Ai H, Henderson JN, Remington SJ, Campbell RE. Biochem J. 2006;400:531–40. doi: 10.1042/BJ20060874. [DOI] [PMC free article] [PubMed] [Google Scholar]
- 25.Fonin AV, Sulatskaya AI, Kuznetsova IM, Turoverov KK. PLoS One. 2014;9 doi: 10.1371/journal.pone.0103878. [DOI] [PMC free article] [PubMed] [Google Scholar]
- 26.Willemse M, Janssen E, de Lange F, Wieringa B, Fransen J. Nat Biotechnol. 2007;25:170–172. doi: 10.1038/nbt0207-170. [DOI] [PubMed] [Google Scholar]
- 27.Yaginuma H, Kawai S, Tabata KV, Tomiyama K, Kakizuka A, Komatsuzaki T, Noji H, Imamura H. Sci Rep. 2014;4:6522. doi: 10.1038/srep06522. [DOI] [PMC free article] [PubMed] [Google Scholar]
- 28.Carlson N, Rechsteiner M. J Cell Biol. 1987;104:537–546. doi: 10.1083/jcb.104.3.537. [DOI] [PMC free article] [PubMed] [Google Scholar]
- 29.Pielak GJ, Li C, Miklos AC, Schlesinger AP, Slade M, Wang G, Zigoneanu IG. 2010;48:226–234. doi: 10.1021/bi8018948. [DOI] [PMC free article] [PubMed] [Google Scholar]
- 30.Shimomura O, Johnson FH, Saiga Y. J Cell Comp Physiol. 1962;59:223–239. doi: 10.1002/jcp.1030590302. [DOI] [PubMed] [Google Scholar]
- 31.Ormö M, Cubitt AB, Kallio K, Gross LA, Tsien RY, Remington SJ. Science. 1996;273:1392. doi: 10.1126/science.273.5280.1392. [DOI] [PubMed] [Google Scholar]
- 32.Griesbeck O, Baird GS, Campbell RE, Zacharias DA, Tsien RY. J Biol Chem. 2001;276:29188–29194. doi: 10.1074/jbc.M102815200. [DOI] [PubMed] [Google Scholar]
- 33.Zacharias DA, Violin JD, Newton AC, Tsien RY. Science. 2002;296:913–6. doi: 10.1126/science.1068539. [DOI] [PubMed] [Google Scholar]
- 34.Wachter RM, Remington SJ. Curr Biol. 1999;9:628–629. doi: 10.1016/s0960-9822(99)80408-4. [DOI] [PubMed] [Google Scholar]
- 35.Dempsey WP, Georgieva L, Helbling PM, Sonay AY, Truong TV, Haffner M, Pantazis P. Nat Methods. 2015;12:645–8. doi: 10.1038/nmeth.3405. [DOI] [PubMed] [Google Scholar]
- 36.Heim R, Tsien RY. Curr Biol. 1996;6:178–182. doi: 10.1016/s0960-9822(02)00450-5. [DOI] [PubMed] [Google Scholar]
- 37.Jayaraman S, Haggie P, Wachter RM, Remington SJ, Verkman AS. J Biol Chem. 2000;275:6047–6050. doi: 10.1074/jbc.275.9.6047. [DOI] [PubMed] [Google Scholar]
- 38.Raut S, Kimball J, Fudala R, Doan H, Maliwal B, Sabnis N, Lacko A, Gryczynski I, Dzyuba SV, Gryczynski Z. Phys Chem Chem Phys. 2014;16:27037–42. doi: 10.1039/c4cp04260c. [DOI] [PMC free article] [PubMed] [Google Scholar]
- 39.Stadtman ER, Levine RL. Amino Acids. 2003;25:207–218. doi: 10.1007/s00726-003-0011-2. [DOI] [PubMed] [Google Scholar]
- 40.Morikawa TJ, Fujita H, Kitamura A, Horio T, Yamamoto J, Kinjo M, Sasaki A, Machiyama H, Yoshizawa K, Ichimura T, Imada K, Nagai T, Watanabe TM. Sci Rep. 2016;6:1–13. doi: 10.1038/srep22342. [DOI] [PMC free article] [PubMed] [Google Scholar]
- 41.Carmody WR. J Chem Educ. 1961;38:559. [Google Scholar]
- 42.James DR, Siemiarczuk A, Ware WR. Rev Sci Instrum. 1992;63:1710–1716. [Google Scholar]
Associated Data
This section collects any data citations, data availability statements, or supplementary materials included in this article.