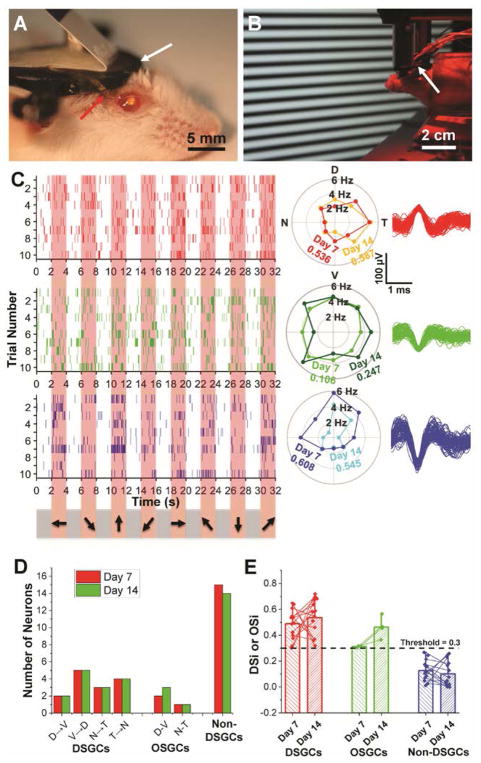
Fig. 3. Chronic in vivo recording and tracking of the same DSGCs.
(A) Photograph showing a mouse immediately after mesh injection. The red and white arrows indicate part of mesh electronics outside of the eye and a head-plate for head fixation. (B) Red-light photograph showing in vivo recording of DSGCs in response to moving grating stimulations (22). (C) Raster (left), polar plots (center) and overlaid spike waveforms (right) of single-unit firing events of three neurons with corresponding colors, from Ch8 in response to moving grating stimulations on Day 7 and 14 post-injection. In the raster plots, the pink shaded regions correspond to times when gratings were displayed on the screen with moving directions indicated by arrows on the bottom (22). Only the raster plots on Day 7 are shown. In the polar plots, DSi for each cell on different days is labeled with corresponding colors. (D) Bar chart summarizing numbers of identified DSGCs, OSGCs and non-DSGCs on Day 7 (red bars) and Day 14 (green bars) post-injection. (E) Bar chart with overlaid scatter plot of DSi or OSi of all RGCs on Day 7 and 14, with thin lines of corresponding colors connecting the same neurons identified on both days. The bar height and the whisker indicate the mean and maximum of DSi/OSi values, respectively. n = 4 for mice used for direction and orientation selectivity studies, while data from one representative mouse is shown in this figure.

