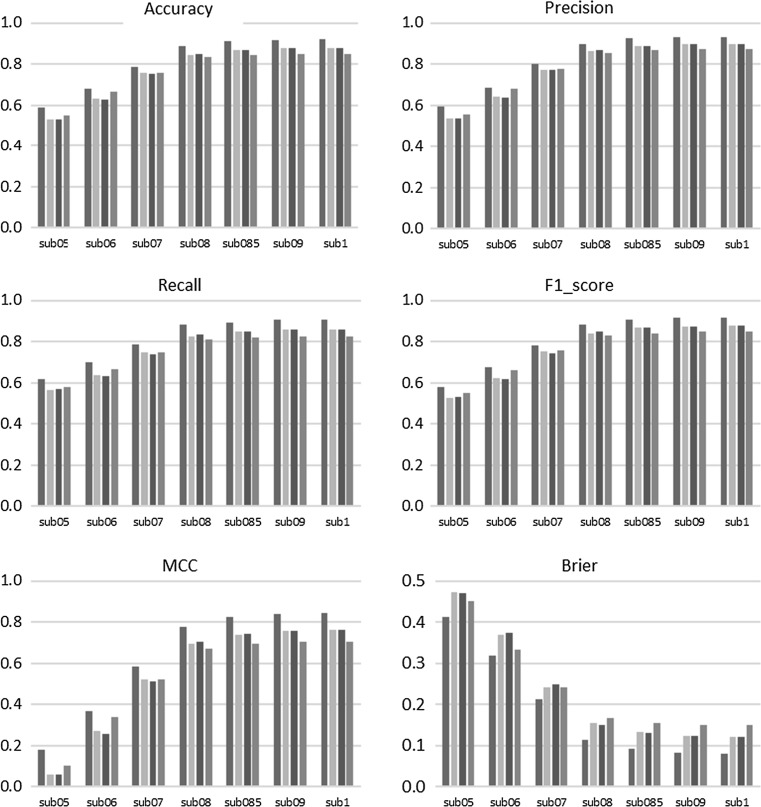
Fig. 4.
Performance of the GBDT method with a different fraction of samples. The left vertical coordinate is for average accuracy, while the horizontal coordinate is the classifier: GBDT (with F = 0.5), GBDT (with F = 0.6), GBDT (with F = 0.7), GBDT (with F = 0.8), GBDT (with F = 0.85), GBDT (with F = 0.9) and GBDT (with F = 1), respectively. Sub05, Sub06, Sub07, Sub08, Sub085, Sub09 and Sub1 represent the GBDT ensemble classifier with the fraction of samples being 0.5, 0.6, 0.7, 0.8, 0.85, 0.9 and 1.0, respectively, where L = 0.1, M = 3, N = 500

