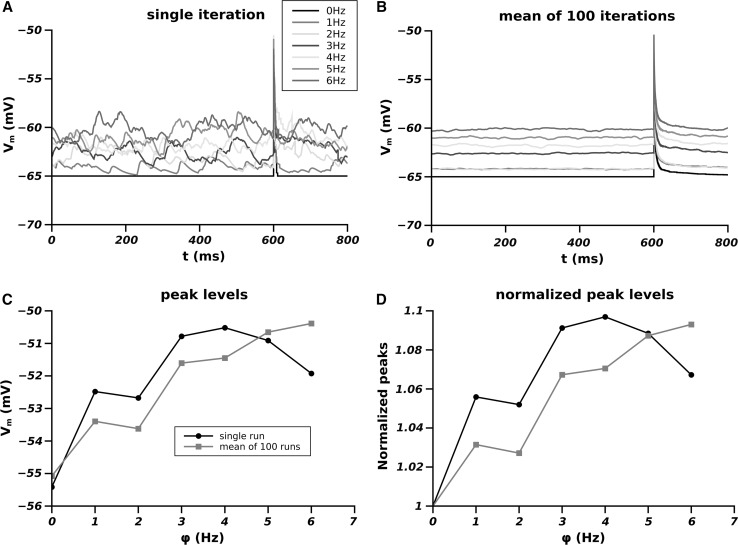
Fig. 2.
Effect of the different firing frequency of the synaptic pools on the membrane potential. A Single run for each frequency; B average of over 100 runs; C peak levels of the EPSPs as function of the firing frequency of the pool (black single run, red averaged over 100 runs); D dependence of the peak level as a function of the firing frequency of the pool normalized to the peak level at (black single run and red average on 100 runs). (Color figure online)

