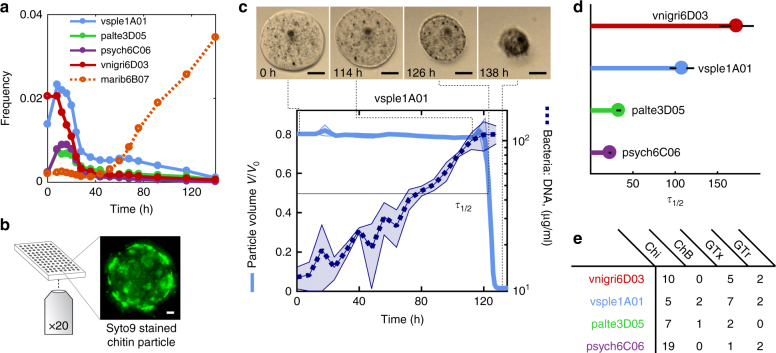
Fig. 1.
Particle degradation dynamics of bacteria isolated from chitin microparticles. a Culture-independent dynamics of four primary degraders (vsple1A01, palte3D05, psych6C06, and vnigri6D03) and a secondary consumer (marib6B07, dotted line). Trajectories shown depict dynamics of selected taxa in particle incubations with raw seawater. Data from ref. 16. b In the laboratory, chitin particles immersed in bacterial suspensions are imaged at the bottom of microtiter plates for up to 240 h. The particle image corresponds to DNA stained palte3D05 after 24 h, showing the formation of bacteria microcolonies on the particle surface. Scale bar corresponds to 10 µm. For a 3D animation of the image, see Supplementary Movie 1. c Particle degradation kinetics (averaged over three different particles) and bacterial growth rate for vsple1A01 (averaged over three different incubations). The particle micrographs correspond to different time points during incubation with vsple1A01. Scale bar: 30 µm (see also Supplementary Movie 2). d Particle half-lives for the four different degraders tested with an inoculum of ~5 × 10⁵ cells per ml. e Number of gene copies of chitinases (Chi), chitin-binding proteins (ChB), GlcNAc-specific chemotaxis (GTx), and transport (GTr) genes. See also Supplementary Table 1

