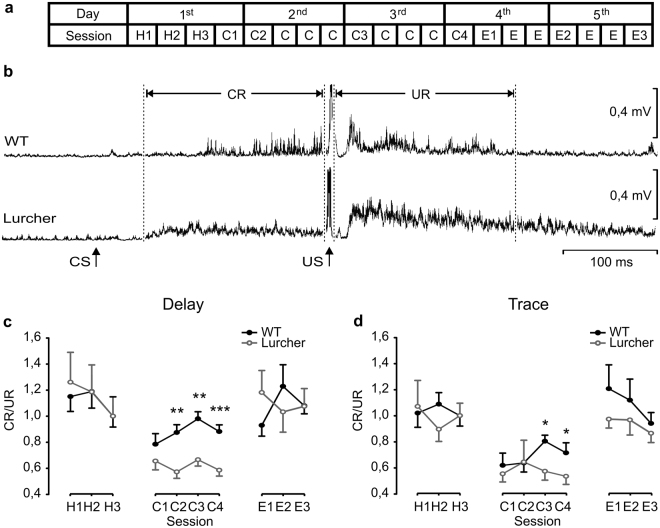
Figure 4.
Evolution of classical eyeblink conditioning of WT and Lurcher mice. (a) Schematic representation of habituation (H), conditioning (C), and extinction (E) sessions, using both delay and trace conditioning paradigms. Each of the five (1st to 5th) training sessions consisted of 200 trials, divided in four sessions of 50 trials each. Sessions analyzed to obtain learning curves, shown in (c) and (d), are indicated by numbers (H1-H3, C1-C4, and E1-E3). (b) rEMG averaged from 50 trials from a C4 session of representative WT and Lurcher mice. CS and US presentations, and the CR and UR sections whose areas were quantified for the formulation of the learning curves shown in (c) and (d) are indicated. (c,d) CR/UR ratios of rEMG areas collected from WT and Lurcher mice during delay (c) and trace (d) conditioning paradigms. Represented data are mean ± SEM of the percentage (%) of CRs (n = 9 animals per group). *P < 0.05; **P < 0.01. Student-Newman-Keuls post hoc one-way ANOVA.

