Figure 6.
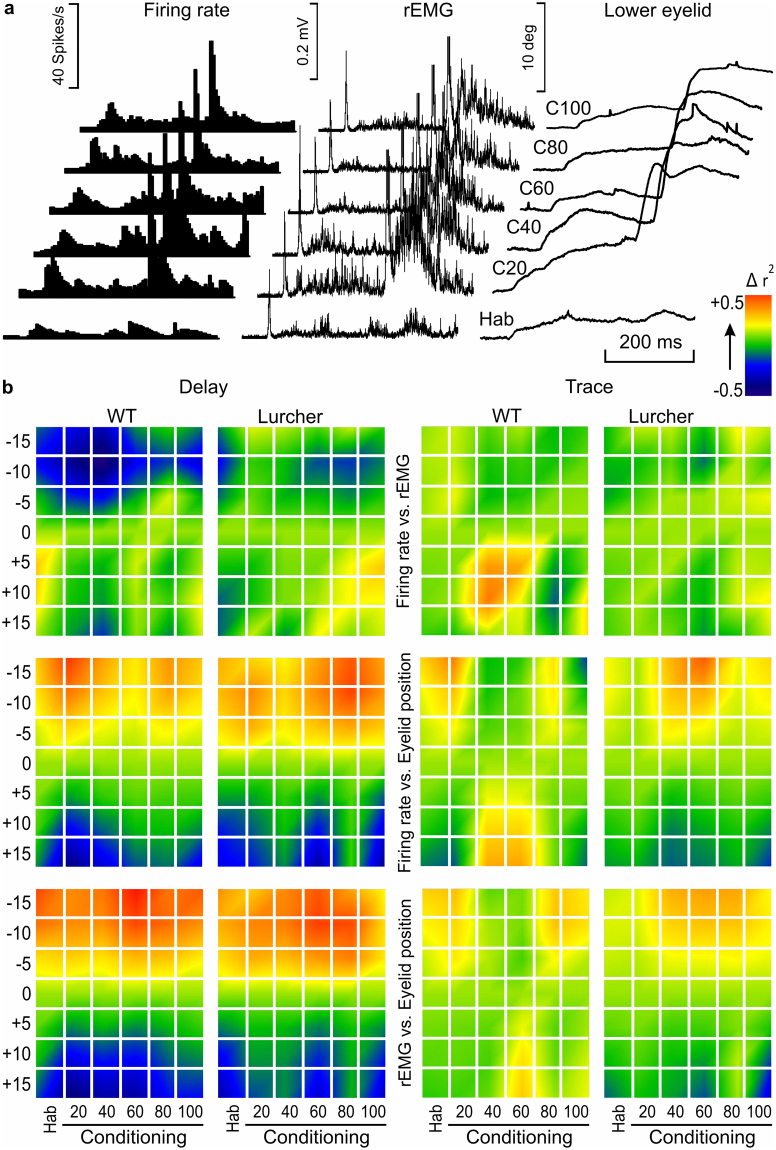
Timing between firing rate, rEMG, and lower-eyelid position during classical eyeblink conditioning using delay and trace paradigms in WT and Lurcher mice. (a) A raster representation of firing rate, rEMG, and lower-eyelid position corresponding to the average of 20 habituation (Hab) and 100 conditioning (c) trials collected during a single conditioning session. Conditioning trials were averaged in groups of 20. Represented data correspond to a WT mouse conditioned with a delay paradigm. (b) Colorimetric representation of the timing correlation between firing rate vs. rEMG (top), firing rate vs. eyelid position (middle), and rEMG vs. eyelid position (bottom) during a single conditioning session from WT and Lurcher mice. r2 values were computed between the first and the second set of records, the latter being shifted −15 ms, −10 ms, −5 ms, +5 ms, +10 ms, and +15 ms from the original (0 ms) timing. A comparison was carried out between regions in the CS-(US −20 ms) interval, each one delimited by turning points automatically detected on the first recording. Normalized r2 values are represented by colored squares corresponding to each shifted time against each average of training (Hab, Conditioning) trials, mice (WT, Lurcher) types, and conditioning (Delay, Trace) paradigms. The color code of normalized r2 values is represented at the top right. Illustrated data correspond to the average of n = 6 animals. Higher r2 values corresponding to negative-shifted recordings indicate a delay of the second recording with respect to the first (correlated) one, while higher r2 values corresponding to positive-shifted recordings indicate an advance of the second with respect to the first. Thus, it is important to note that whereas eyelid movement is delayed with respect to the firing rate (middle) and, obviously, with respect to the rEMG (bottom), the rEMG is advanced with respect to the firing rate (top), particularly in the case of WT mice conditioned with delay paradigms.

