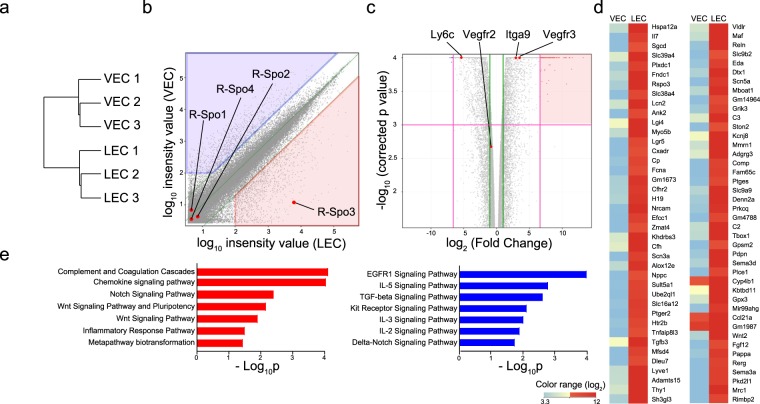
Figure 4.
Transcriptome analysis of intestinal LECs. The transcriptome of VECs and LECs sorted from the small intestines was analyzed (n = 3/group). (a) Hierarchical clustering using the Euclidean distance of each samples. (b) Scatter plot shows the expression levels of each entity in LECs and VECs. The list of 1226 entities that were up-regulated (fold change >5 and expression level in LECs >100; red shaded) and 975 entities that were down-regulated (fold change >5 and expression level in VECs >100; blue shaded) in LECs is shown in Supplementary Table 2. (c) Volcano plots with relative differences in expression levels between VECs and LECs and the p value of each entity. Green lines indicate fold change <0.5 or >2, and magenta lines indicate fold change <0.01 or >100 and p < 0.001. (d) A heatmap shows the expression levels of highly LEC-specific genes (fold change >100 and p < 0.001; red shaded in Fig. 3c). (e) Biological pathways from WikiPathways were assigned to each entity selected in (b). The bar charts display the negative log of the enrichment p values for each pathway enriched in LECs (red) or VECs (blue).

