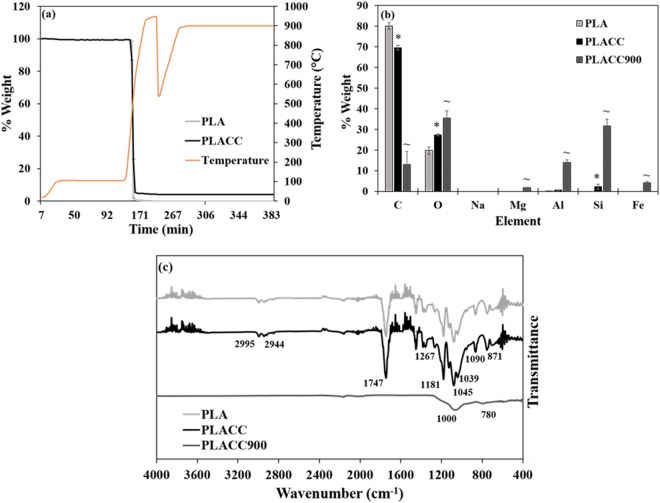
Figure 1.
(a) Thermal degradation profile of PLA and PLACC as determined by TGA (n = 2). Chemical characteristics analysis. (b) Elemental composition of PLA, PLACC, and PLACC900 as determined by EDX (n = 5; taken from 5 different areas on the sample). The symbol * and ~ indicate significant differences between PLA and PLACC and between PLACC and its incinerated byproduct, PLACC900, respectively. (c) FTIR spectra for PLA, PLACC, and PLACC900 (n = 2).

