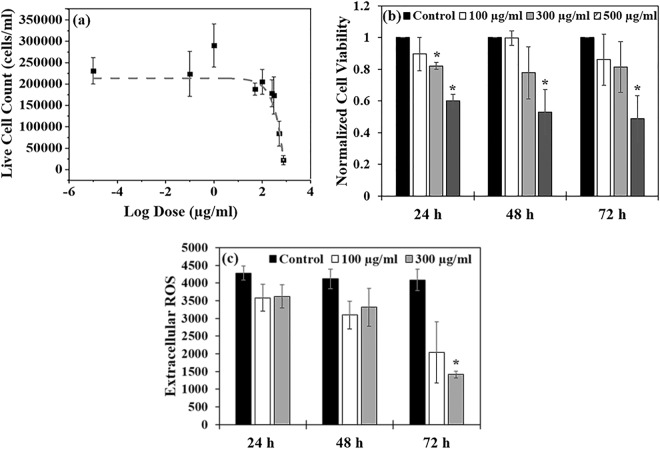
Figure 4.
(a) Dose response curve (based on live cell counts) for BEAS-2B cells exposed to PLACC900 from 0–750 µg/ml (n = 5). The data was fit via a sigmoidal curve using OriginPro (OriginLab Corporation) software. (b) Cellular viability (based on WST assay) for cells exposed to PLACC900 (n = 6). The symbol * indicates a significant difference between the control cells and exposed cells. The values are normalized relative to the controls. (c) Extracellular ROS of cells exposed to varying doses of PLACC900 (n = 4). The symbol * indicates a significant difference between the control cells and exposed cells. Significance was determined by one-way analysis of variance ANOVA with p < 0.05, * indicating significance.

