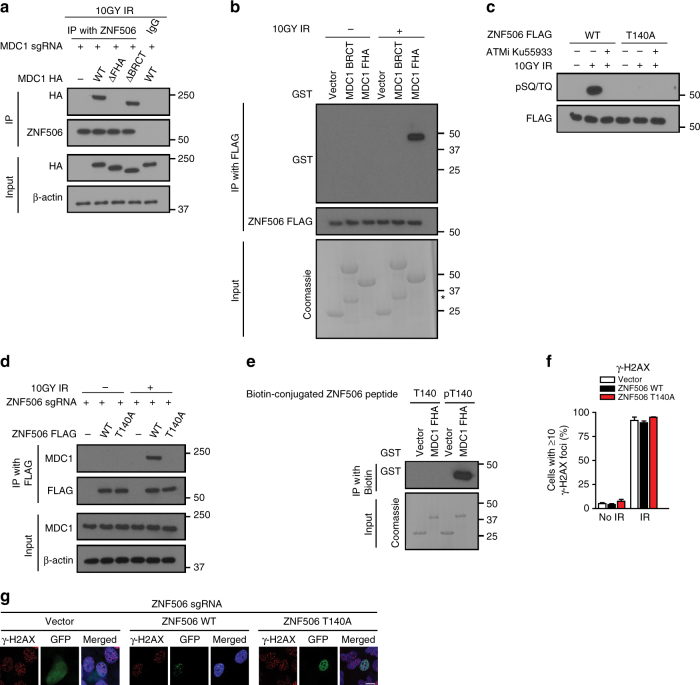
Fig. 2.
DNA damage-induced ATM-dependent phosphorylation of ZNF506 is required for its MDC1-mediated recruitment to the DNA double-strand break site. a ZNF506 interacts with the FHA domain of MDC1 upon DNA damage. Deletion of the FHA domain (ΔFHA) abrogates the interaction between MDC1 and ZNF506 in HEK293 cells. MDC1 knockout cells were transfected with the indicated plasmids and exposed to radiation. An hour later, interaction between endogenous ZNF506 and MDC1 fragments were assessed. b ZNF506 interacts with the FHA domain of MDC1 in vitro. c ATM phosphorylates ZNF506 at the T140 residue in HEK293 cells following DNA damage. ATM inhibitor (ATMi) KU55933 was used as a control. Cells were transfected with the indicated tagged constructs, co-immunoprecipitation was performed, and the blot was probed with pSQ/TQ antibody. d Phosphorylation of ZNF506 is required for its interaction with MDC1. Endogenous ZNF506 was knocked out in HEK293 cells using CRISPR and the indicated FLAG-tagged constructs were expressed. Cells were exposed to the indicated doses of radiation. Lysates were collected after an hour and immunoprecipitation with FLAG was performed. Blots were probed with the indicated antibodies. e The FHA domain of MDC1 directly interacts with phosphorylated ZNF506. The indicated peptides of ZNF506 (T140 (control) and pT140) were incubated with GST control vector or GST-tagged FHA domain of MDC1. The blot was probed with the indicated antibody. f, g Phosphorylation of ZNF506 is required for its recruitment to DNA double-strand break sites in U2OS cells. Mutation of the phosphorylation site on ZNF506 abrogates its localization to DSB sites. Cells were exposed to 2 Gy irradiation (IR) and stained for the indicated foci (red). Nucleus is stained with DAPI (blue). f Quantification of the indicated foci in U2OS cells after the indicated treatment. g Representative images of the indicated foci in U2OS cells an hour after 2 Gy IR. Shown are the representative data (mean ± SEM) from three independent experiments in f. Representative images of three independent experiments are shown in g. Scale bars, 10 µm. Representative western blots in a–e are provided from three biologically independent experiments. Unprocessed blots are provided in Supplementary Fig. 5

