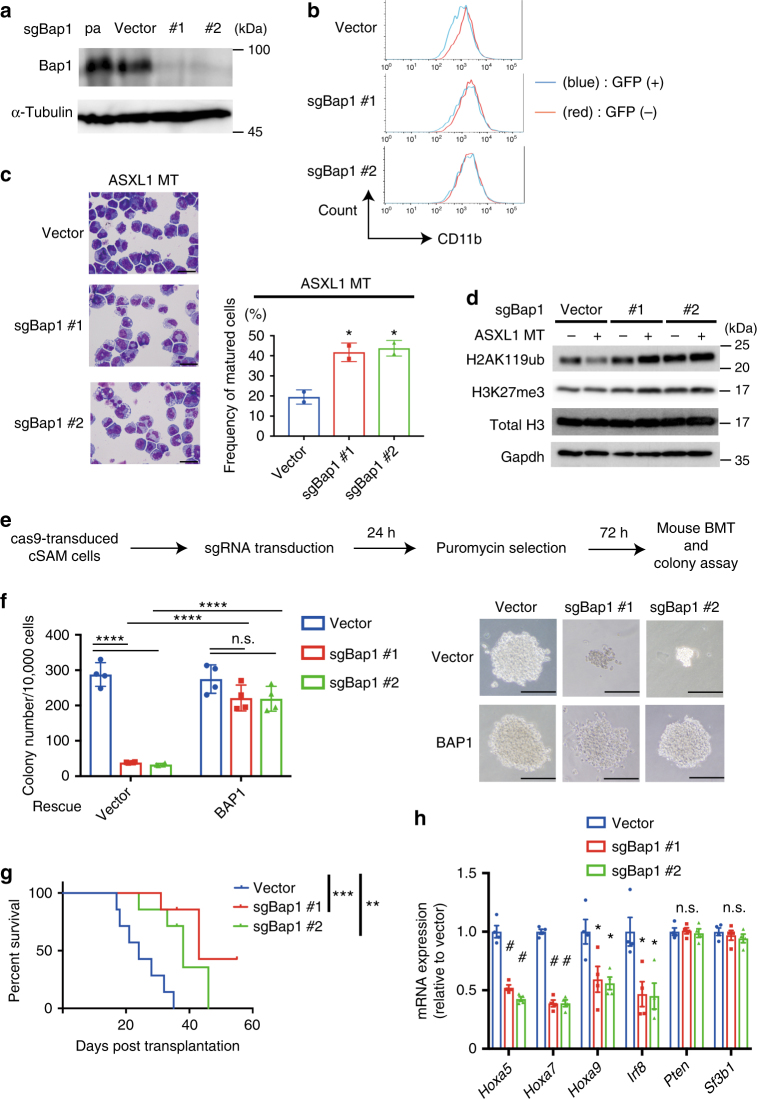
Fig. 7.
Depletion of BAP1 abrogates ASXL1-MT-induced differentiation block and inhibits leukaemogenesis. a 32Dcl3 cells were first transduced with Cas9, and were then transduced with a vector control or two independent sgRNAs targeting Bap1. Cell lysates were extracted from these cells and parent 32Dcl3 cells (pa), followed by immunoblotting analysis. b 32Dcl3 cells described in (a) were transduced with ASXL1-MT (coexpressing GFP), and were cultured with 50 ng/ml G-CSF. CD11b expression in untransduced (GFP−, red line) and transduced (GFP+, blue line) cells was assessed on day 6. c Morphology of the cells described in (b) was assessed by Wright–Giemsa staining. Original magnification, ×1000; Scale bars: 20 μm (left). Two independent experiments were performed, and proportions of segmented cells are shown as mean ± s.e.m. (right). *P < 0.05, one-way ANOVA with Dunnett’s multiple comparisons test. d Cell lysates extracted from 32Dcl3 cells described in (b) were subjected to immunoblotting. e Experimental scheme used in (f–h). Primary leukemia cells transformed by ASXL1-MT and SETBP1-D868N (cSAM cells) were transduced with Cas9 and Bap1-targeting sgRNAs, and were cultured in semisolid medium or transplanted into recipient mice. f Bap1-depleted cSAM cells produced significantly reduced numbers of colonies compared with control cSAM cells. Expression of human BAP1 reversed the reduced colony formation of Bap1-depleted cSAM cells. Colony numbers were counted on day 7 (n = 4). Data are shown as mean ± s.e.m. ****P < 0.0001, two-way ANOVA with Tukey’s multiple comparison test (left). Representative photos of colonies are also shown (right). Scale bars: 200 μm. g Survival curves of recipient mice transplanted with vector- or sgBAP1-transduced cSAM cells (n = 7 each). **P = 0.0031, ***P = 0.0008, log-rank test. h Relative expression of Hoxa5, Hoxa7, Hoxa9, Irf8, Pten, and Sf3b1 were assessed in vector- or sgBAP1-transduced cSAM cells using qRT-PCR. Results were normalized to Gapdh, with the relative mRNA level in vector-transduced cells set at 1. Data are shown as mean ± s.e.m. of four biological independent experiments. *P < 0.05, #P < 0.01, one-way ANOVA with Dunnett’s multiple comparisons test

