
Figure 2.
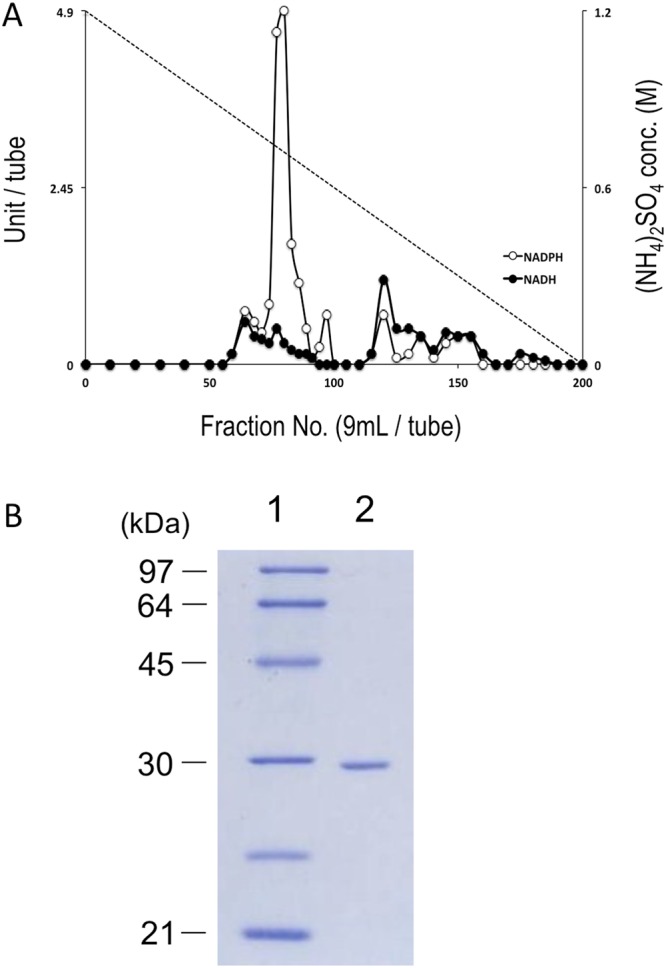
(A) Chromatographic elution profiles of B. infantis NADH and NADPH oxidases. Cell extracts, after treatment with streptomycin sulfate and ammonium sulfate, were applied to a Butyl-TOYOPEARL column equilibrated with 1.2 M ammonium sulfate in 50 mM potassium phosphate buffer (pH 7.0). After sample loading, the bound proteins were eluted with a linear gradient of ammonium sulfate, from 1.2 to 0 M, dissolved in the same buffer. Black circles, NADH oxidase activity; white circles, NADPH oxidase activity; dashed line, ammonium sulfate concentration (conc.). (B) SDS-PAGE of the purified B. infantis NPOX protein. After electrophoresis, the gel was stained with Coomassie brilliant blue. The protein standards (lane 1) and purified protein (lane 2) are indicated, along with the corresponding molecular masses (indicated on the left in kDa).