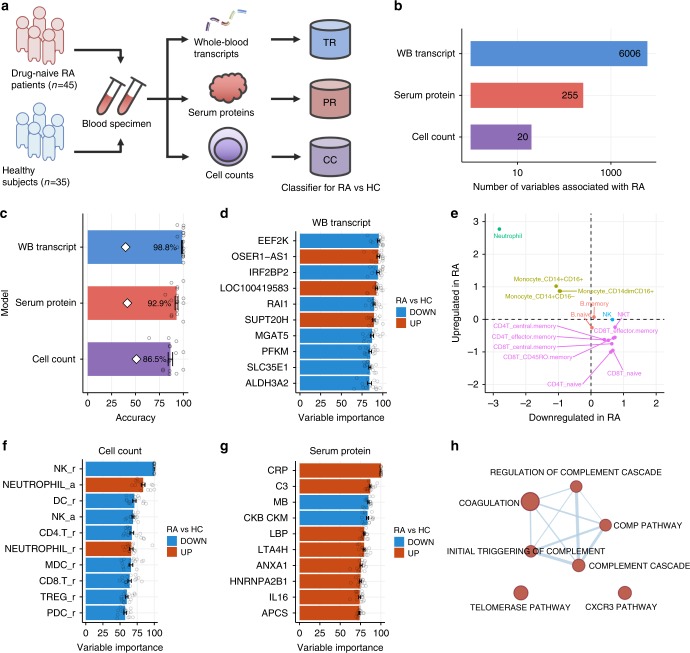
Fig. 1.
Identification of molecular signatures associated with drug-naive patients with RA. a Study design. TR, PR, and CC represent the transcript-based model, the protein-based model, and the cell-count-based model, respectively. b The number of variables associated with drug-naive patients with RA. A linear regression model was used to compare the levels of variables between RA and HC accounting for age. For the transcripts, the RNA integrity number was also included in the model. The false discovery rate was controlled at 5%. c Cross-validation performances of RA diagnostic models. PLSR was employed to build predictive models. Fifteen PLSR models for each data type were generated using 15 different portions of samples as training data. The bar plot represents the average prediction accuracies against the testing data with the standard deviation. White diamonds indicate the expected accuracy of the null models estimated by 1000 sample permutations. d The top ten important transcripts for discriminating patients with RA and HC. Error bars represent the variabilities of the contribution to the model prediction that originated from the model ensemble. e Expression profiles of important transcripts across 15 immune cells. Meta-expression features of important upregulated or downregulated transcripts in RA were calculated separately using the ssGSEA method and standardized across immune cells. f The top ten important cell types for discriminating between patients with RA and HC. A suffix of “r” indicates that the cell counts were normalized to the total number of white blood cells, and a suffix of “a” indicates absolute cell counts. g The top ten important serum proteins for discriminating patients with RA and HC. Error bars represent the variabilities of the contribution to the model prediction that originated from the model ensemble. h Biological enrichment of influential serum proteins in the model. Serum proteins with a variable importance greater 50 were used for enrichment analysis using hypergeometric test. The biological concepts enriched at the significance level of p value <0.05 and FDR <0.05 are displayed. Red nodes represent biological concepts enriched with proteins that are upregulated in RA. Nodes are connected if there are shared genes in two biological pathways. The error bars represent standard errors

