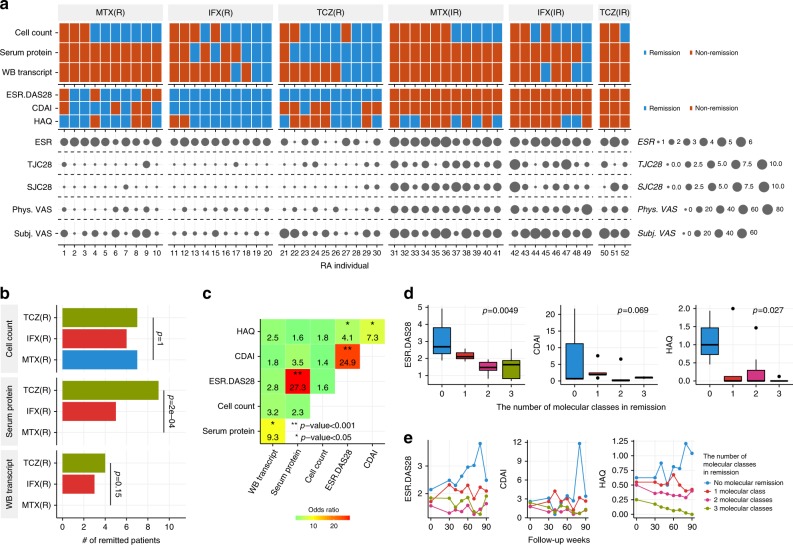
Fig. 3.
Relationship between MR and disease severity indexes. a MR profiles along with disease severity indexes at week 24. R and IR indicate drug responders and inadequate responders, respectively. Each column represents MR and disease severity indexes of a single patient with RA. Disease severity indexes include DAS28-ESR, CDAI, HAQ, ESR, tenderness joint counts using 28 joints (TJC28), swollen joint counts using 28 joints (SJC28), physician visual analog scale (Phys. VAS), and subject visual analog scale (Subj. VAS). b Comparison of drug effects on the induction of MR. The proportions of patients who achieved remission were compared across three treatment arms by Fisher’s exact test. c Correlation of remission indexes. The coincidence of remission states based on two different indexes was evaluated by the two-sided Fisher’s exact test. The number and color represent the odds ratio, where remissions occurred simultaneously. d The MR state is associated with disease activities for patients in CR at 90 weeks. A linear model was used to evaluate the correlation between the number of biological levels that achieved remission states and the disease activities after 90 weeks in RA patients who were treated with biologics (n = 20). The upper, center, and lower line of the boxplot indicates 75%, 50%, and 25% quantile, respectively. The upper and lower whisker of the boxplot indicates 75% quantile +1.5 * interquartile range (IQR) and 25% quantile −1.5 * IQR. e The temporal changes in DAS28-ESR, CDAI, and HAQ values during the follow-up period, which was split into 10-week intervals. For each patient, the average of multiple measurements of the DAS28-ESR, CDAI, and HAQ values within the same interval was calculated, and then the mean of these values from different individuals was calculated

