Fig. 5.
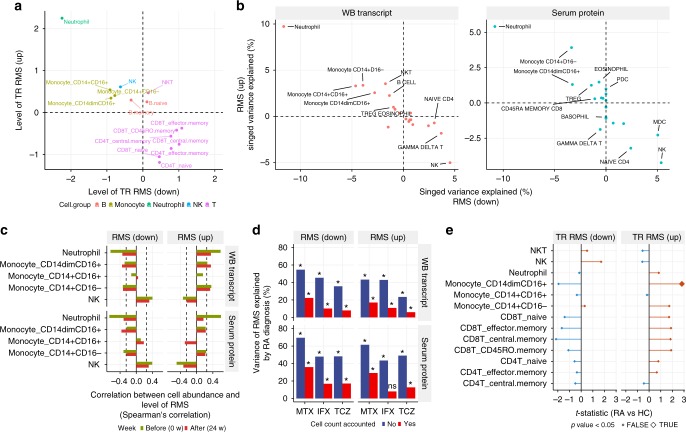
Alterations in cell compositions and cellular-level expression explain RMS. a Expression profiles of transcriptional RMSs across 15 immune cells. Meta-expression features for the transcriptional RMS that were upregulated or downregulated in RA were calculated separately using the ssGSEA method and standardized across immune cells. b The contribution of cell abundance to RMSs. Multivariate linear regression with elastic net regularization was used to estimate the variations in RMSs explained by the absolute cell counts using samples from HCs and drug responders (n = 182). c Correlation between RMSs and cell counts of neutrophil, monocytes, and NK cells. d The variance in RMS explained by RA diagnosis. The proportion of variance in RMS explained by RA diagnosis was calculated with or without accounting for the contribution of cell counts to RMS. The contribution of cell counts to RMS was accounted for by a multivariate linear regression. The asterisk represents a p value <0.05. e Comparison of transcriptional RMSs between patients with RA and HCs in purified immune cells. The levels of transcriptional RMSs in each immune cell were quantified using ssGSEA and compared between RA patients and HCs via a linear model for each cell type

