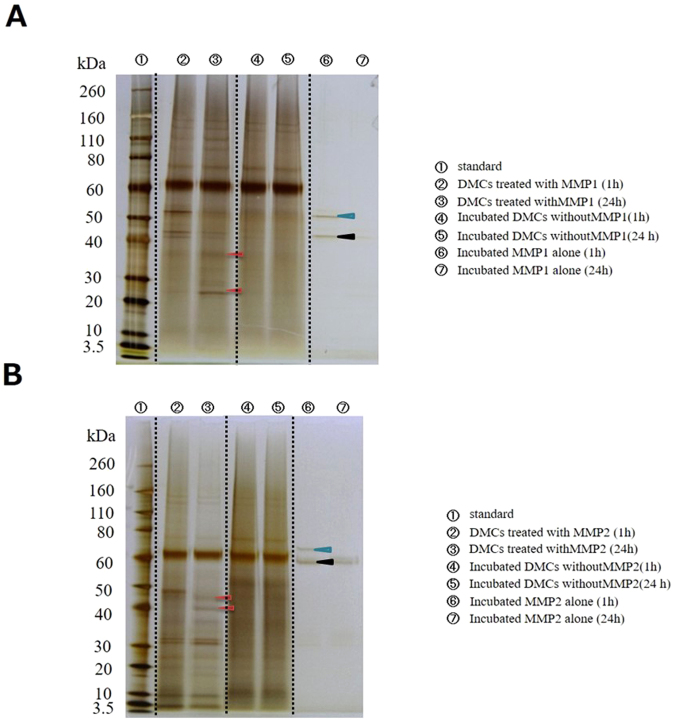
Figure 1.
Protein profiles (silver staining) of dentin matrix components (DMCs) treated with matrix metalloproteinase (MMP)-1 (A) or MMP-2 (B) are shown as a merged view by combining images of the cropped blots and gels. Dotted lines indicate the borders of the cropped blots. The incubation time influenced the protein profile. Red arrowheads indicate the differences between protein profiles of MMP-treated DMCs following 1- and 24-h incubation. Light blue arrowhead indicates pro form of predicted MMP-1 and MMP-2, respectively. Black arrowhead indicates active form of predicted MMP-1 and MMP-2. Original full blots/gels are presented in Supplementary Fig. 13.

