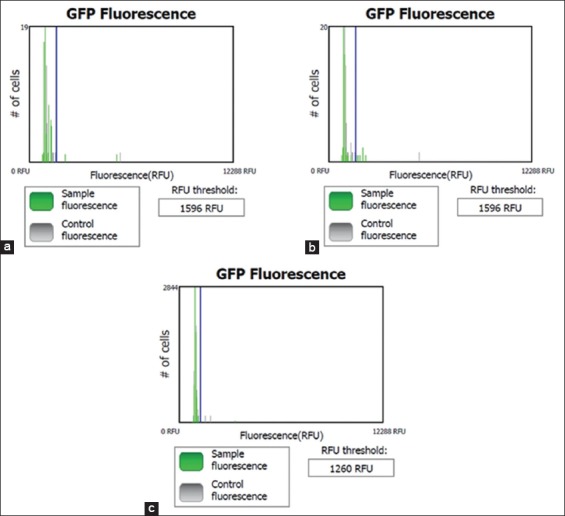
Figure-4.

Cytometry of immunofluorescence assay using fluorescence isothiocyanate in (a) peripheral blood mononuclear cell culture as control negative, (b) no treatment human immunodeficiency virus (HIV) culture as a positive control, (c) HIV culture treat by the addition of PLA2 (PLA2+HIV). The peak by green color on the right side of a threshold shows among of expression of HIV protein. The graph indicates that amount of expressed HIV protein in PLA2+HIV culture is less than no treatment HIV culture.
