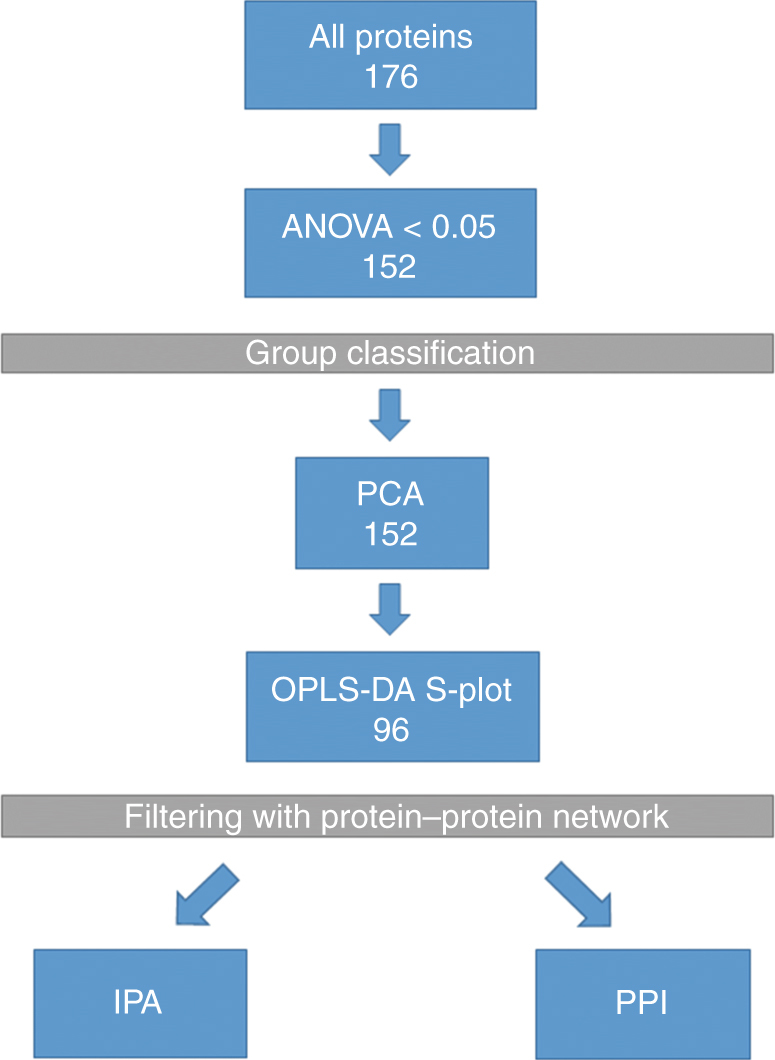
Fig. 1.

Data analysis workflow. Protein quantification data were from ultra-definition MSE, and proteins with two or more unique peptides were approved for identification. ANOVA cut-off of 0.05 was used. PCA: principal component analysis is used to visualise the variation between groups. OPLS–DA: latent structures discriminant analysis brings data for the S-plot for an efficient comparison of protein expression profiles. PPI: protein–protein interaction network gives the known and predicted functional and physical associations between single proteins in the S-plot. IPA: Ingenuity pathway analysis is an analysis tool revealing pathways and potential networks associated with the given data
