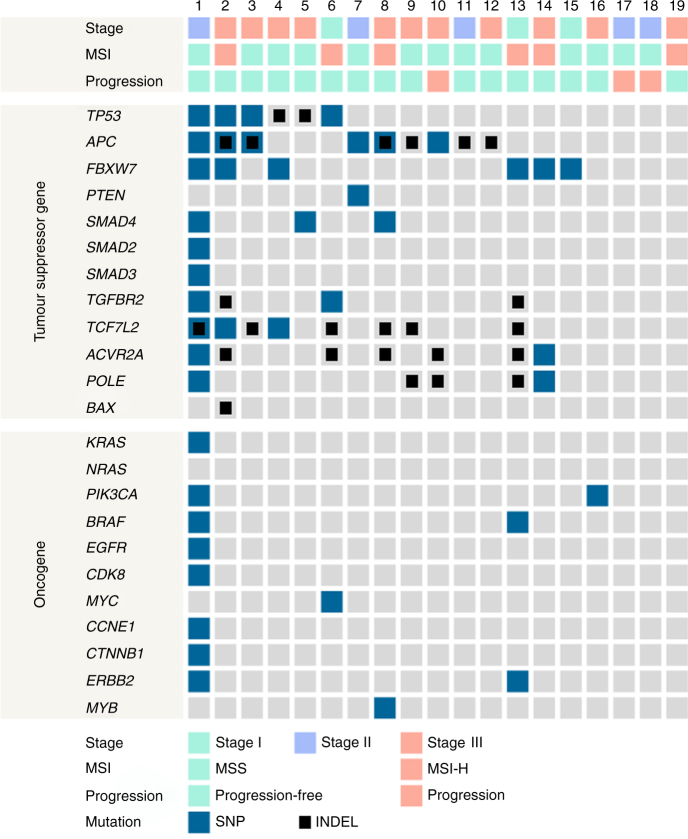
Fig. 2.
Schematic overview of mutation profiling. Mutual exclusivity of fusion genes with oncogenic mutations was represented, except TMOD3-MAPK6. The numbers on top designate each patient sample ID with fusion genes; 1, TMOD3-MAPK6; 2, TPM3-NTRK1; 3, NAGLU-IKZF3; 4, ATIC-UXS1; 5, TMPRSS2-PDE9A and TPM3-NTRK1; 6, BOK-ING5; 7, GTF3A-CDK8; 8, TRIM24-BRAF; 9, RNF121-FOLR2; 10, PTPRK-RSPO3; 11, RASA1-LOC644100; 12, TAF4-NDRG3; 13, ANAPC1-ZC3H8 and ZYG11A-GPX7; 14, BOD1-WWC1, RIMS3-SCMH1, STRN-ALK, and USP32-NSF; 15, OSBPL10-GADL1; 16, APC-COMMD10 and VTI1A-TCF7L2; 17, RAB1B-DPP3; 18, LMNA-NTRK1; 19, CHIC1-HDX and PTPRK-RSPO3

