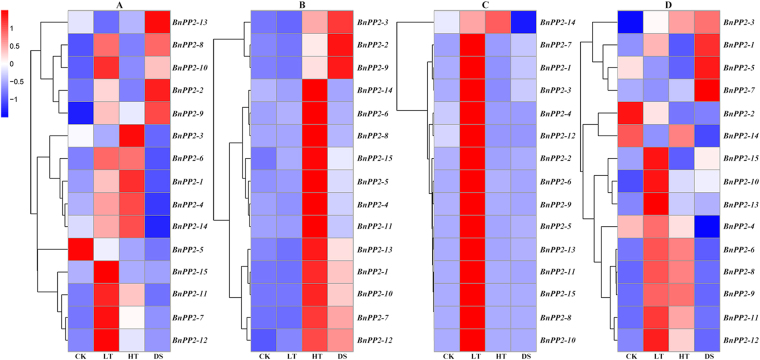
Figure 4.
The relative expression level of BnPP2 genes within four tissues in ramie under LT, HT and DS treatments. (A–D) indicates leaf (without main vein), petiole, bark and stem, respectively. The relative expression level (REL) was distinguished by the color of the gradient, the red for high expression level, while the blue for low expression level. The expression levels (using eEF1α as the endogenous control) were transformed (log1+REL) into colors in order to assess their overall expression levels. CK, plants from the normal condition for control; LT, low temperature; HT, high temperature; DS, drought stress. The color key in the upper left corner of the figure.

