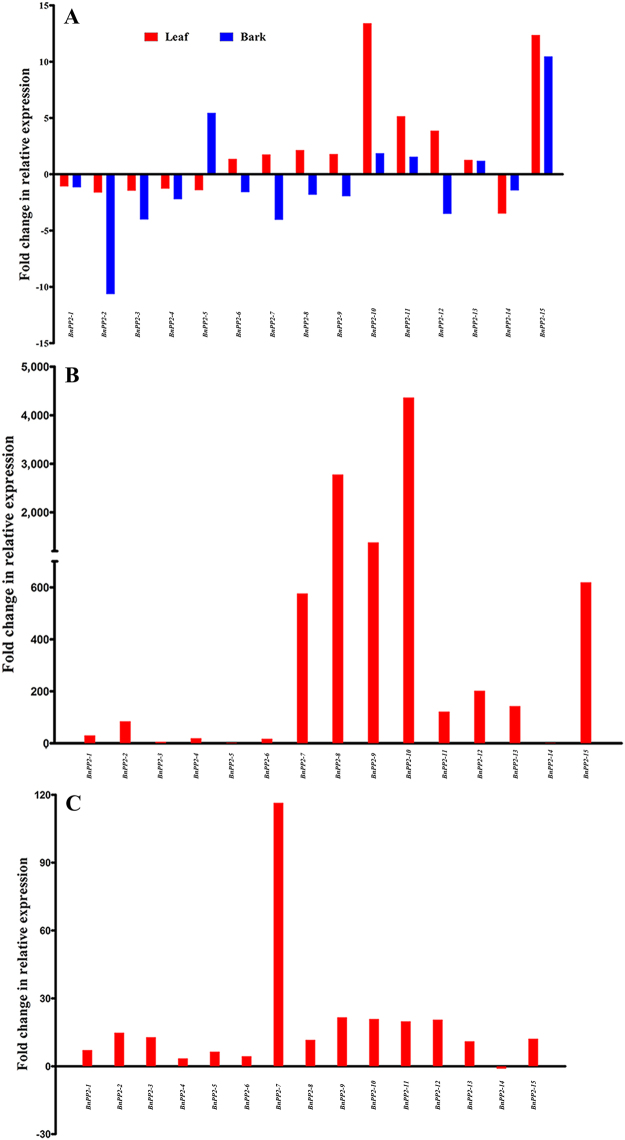
Figure 5.
The fold change in relative expression of BnPP2 genes in response to MW, IF and FI. Expression data were presented as fold change by comparing with the control. The blue color block represents data for leaf, while the red color block indicates bark. (A) MW (mechanical wounding); (B) Insect-feeding; (C) Fungal infection. The fold change was calculated by REL (Treatment)/REL (control) (up-regulated) or REL (control)/REL (Treatment) (down-regulated).

