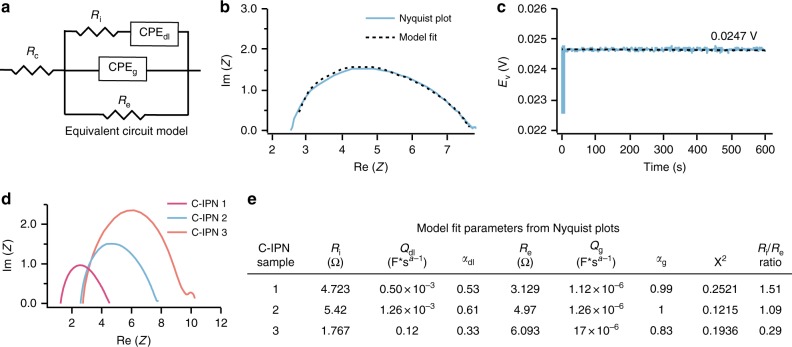
Fig. 4.
Characterization of dual ionic and electronic conductivity. a Equivalent circuit model representing the bulk C-IPN hydrogel. Re represents electronic resistance, Ri represents ionic resistance, CPEdl represents the double-layer capacitive phase element (CPE), whereas CPEg represents the geometric CPE. CPE elements are used to account for inhomogeneous or imperfect capacitance, and are represented by the parameters Q and α, where Q is a pseudocapacitance value and α represents its deviation from ideal capacitive behavior. The true capacitance (C) can be calculated from these parameters by the relationship C = Q ωmaxα-1, where ωmax represents the frequency at which the imaginary component reaches a maximum43. Rc represents the total ohmic resistance of the cell assembly. b Nyquist plot obtained from performing electrochemical impedance spectroscopy (EIS) through a bulk C-IPN 2 gel, overlaid with the plot predicted from the equivalent circuit model. Impedance was measured between 500 mHz and 7 MHz, with higher real components of the impedance obtained at lower frequencies. c When a constant DC current of 5 mA is applied through the C-IPN 2 gel, the voltage across the gel plateaus to a value of 0.0247 V. This value can be used to calculate an electronic resistance that is comparable to the value of Re extracted from the model. d Overlay of Nyquist plots obtained for three C-IPN formulations, where C-IPN 1 is the stiffest and densest, and C-IPN 3 is the softest and least dense. Impedance was measured between 500 mHz and 7 MHz, with higher real components of the impedance obtained at lower frequencies. e Values for all relevant parameters extracted for the three C-IPN formulations by fitting their EIS data with the equivalent circuit model. As the gel stiffness and density increase, the relative ionic resistance within the gel increases as well

