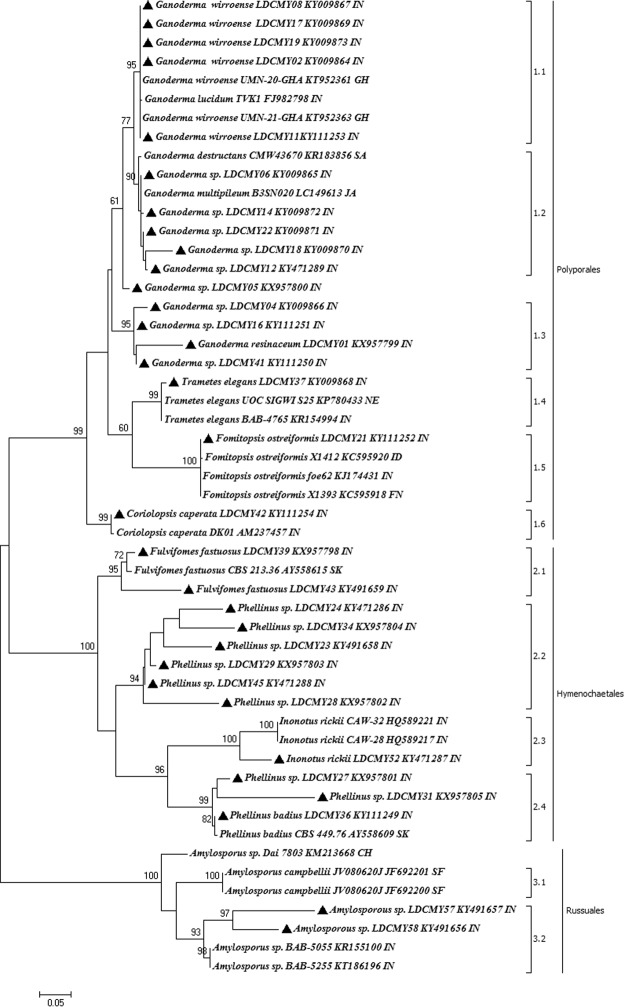
Figure 7.
The evolutionary relationship was inferred using the maximum Likelihood method in MEGA6. The analysis involved 52 nucleotide sequences; thirty two sequences generated in this study are highlighted. The initial trees were obtained with the random addition of sequences. All positions containing gaps and missing data were eliminated. Numerical values above the internodes are the percentage of 1000 bootstrap replications. Bootstrap values higher than 60% are indicated. Scale bar 0.05 represents nucleotide substitutions per position. Three clades were predicted Clade 1: Polyporales; Clade 2: Hymenochaetales; Clade 3: Russuales. The abbreviated letters next to accession number indicates the localities from which the sample is collected: IN - India, GH - Ghana, CH- China, ID - Indonesia, FL - Finland, NE - Nepal, SA - South Africa, SF - South Florida, SK - South Korea, SL - Sri Lanka. The diversity within subpopulation was predicted as 0.1, the diversity within entire population - 0.3 with a Mean inter population Diversity - 0.3 and Coefficient of differentiation - 0.8.

