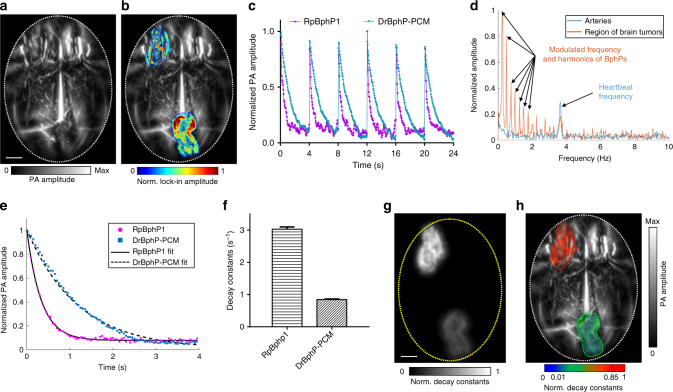
Fig. 3.
Multi-contrast PA imaging of BphPs in the mouse brain in vivo. a Conventional PA image of the tumor-bearing mouse brain cortex vasculature (ON state). Approximately 1 × 10⁶ U87 cells expressing DrBphP-PCM were injected into the left front of the brain, ~1 × 10⁶ U87 cells expressing RpBphP1 were injected into the right rear of the brain. The tumors are invisible in the ON state images due to the overwhelming background signals from blood. Scale bar, 2 mm. b LIR image overlaid on the mouse brain cortex vasculature, highlighting the two tumors of U87 cells expressing either RpBphP1 or DrBphP-PCM. The overlay image shows the BphP signals in color and the background blood signals in gray. c PA signals from two tumors were modulated at the same frequency by the illumination but with different signal decay constants. d Temporal frequency spectra of the PA signals from brain tumors and the cortical arteries, showing both the harmonics of the illumination modulation frequency and the heartbeat frequency from the arteries. e PA signal decays and their fits for the two tumors expressing either DrBphP-PCM or RpBphP1. f The computed decay constants of the two tumors; error bars are s.e.m. (n = 160), calculated based on the pixel values from regions of interest. g Decay constant encoded image illustrating good separation of the two tumors. Scale bar, 2 mm. h Decay constant encoded image overlaid on the mouse brain cortical vasculature, showing reliable separation of two tumors

