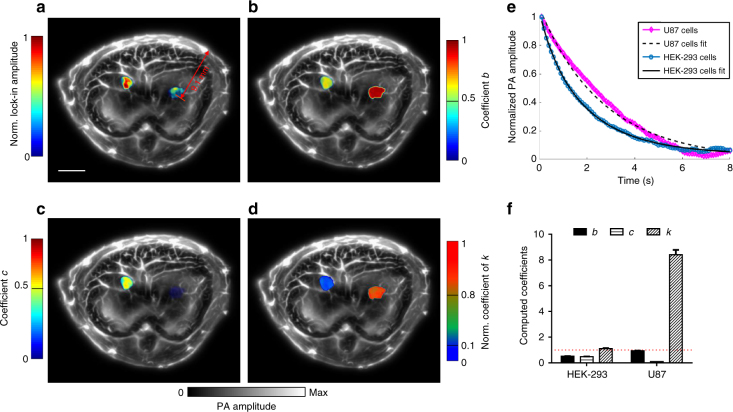
Fig. 5.
In vivo separation of two types of cells at depths. The PA excitation wavelength was 780 nm. a LIR image overlaid on a conventional PACT cross-sectional image by 780 nm illumination, highlighting the two tumors of HEK-293 cells expressing both DrBphP-PCM and RpBphP1 (left lobe) or U87 cells expressing DrBphP-PCM (right lobe) inside the liver (n = 3). The overlay image shows the BphP signals in color and the background blood signals in gray. b Coefficient b encoded image overlaid on a conventional PACT cross-sectional image. The computed coefficient, b, is shown in color, and the background anatomy is shown in gray. The LIR image in a was used to form a binary mask, and the decay analysis was implemented in the masked regions. c Coefficient c encoded image overlaid on a conventional PACT cross-sectional image. The computed coefficient, c, is shown in color, and the background anatomy is shown in gray. d Normalized coefficient k encoded image overlaid on a conventional PACT cross-sectional image. Because the HEK-293 tumors contain two different photochromic proteins and U87 tumors contain only one photochromic protein, the normalized coefficient k of HEK-293 tumors is much smaller than that of U87 tumor, showing a reliable separation of the two tumors. The LIR image was used to form a binary mask, and the decay constant computation was implemented in the masked regions. e PA signal decays and their fits in the tumor regions. f The computed coefficients of b, c, and k from the tumor regions, where k, showing the largest difference, can be used to separate the two types of tumors. Independent of the light fluence, the coefficient k for HEK-293 tumors is ~1, and the coefficient k for U87 tumors is much larger (>8); error bars are s.e.m. (n = 140), calculated based on the pixel values from regions of interest. Scale bar, 5 mm

