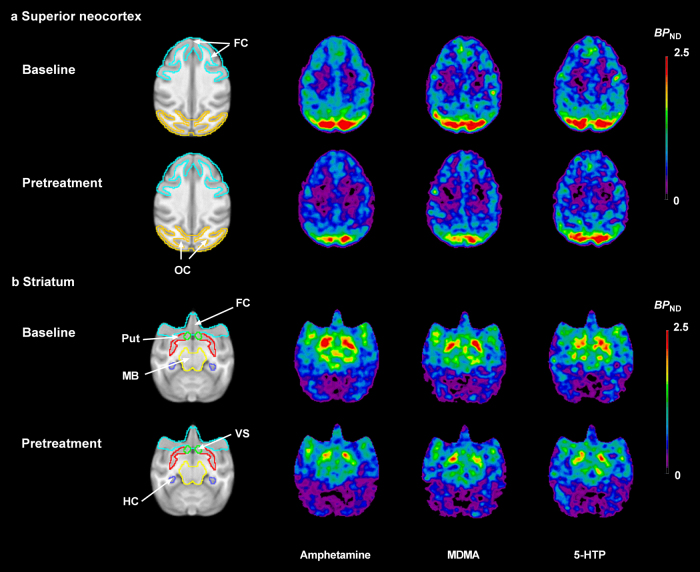
Fig. 2. Mean parametric BPND images of [11C]AZ10419369 derived by the equilibrium method at baseline (different n for each pretreatment condition) and following pretreatment with 3 different experimental drugs (n = 3 for each experimental condition): amphetamine 1 mg/kg, 3,4-methylenedioxymethamphetamine (MDMA) 1 mg/kg and 5-hydroxy-L-tryptophan (5-HTP) 5 mg/kg.
The images were normalized to an in-house cynomolgus brain template. a Axial view of images at the level of superior neocortex. b Axial view of images at the level of striatum. FC frontal cortex, HC hippocampus, MB midbrain, OC occipital cortex, Put putamen, VS ventral striatum

