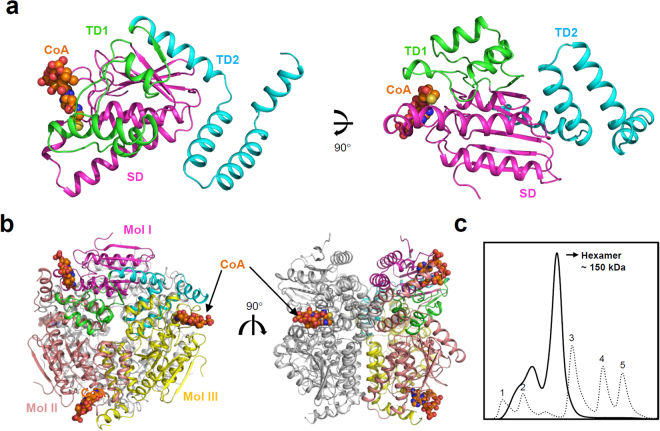
Figure 2.
Overall structure of Ms3HPCD. (a) The monomeric structure of Ms3HPCD. The Ms3HPCD structure is shown as a cartoon diagram. SD, TD1, and TD2 are distinguished by different colors of magenta, green, and cyan, respectively, and labeled appropriately. The bound CoA molecule is shown as an orange colored sphere. The right figure is the left figure rotated horizontally by 90°. (b) Hexameric structure of Ms3HPCD. The hexameric structure of Ms3HPCD is presented as a cartoon diagram. Mol I is presented with a color scheme same as (a). Mol II and III are presented with colors of salmon and yellow, respectively. The other trimer is shown with a grey color. The bound CoA molecule is shown as sphere models with an orange color. The right figure is rotated by 90° vertically from the left figure. (c) Size-exclusion chromatography of Ms3HPCD. The Ms3HPCD and standard samples are distinguished with solid and dotted lines, respectively. 1, 2, 3, 4, and 5 indicate void and standard samples of Ferritin (440 kDa), Conalbumin (75 kDa), Carbonic anhydrase (29 kDa), Ribonuclease A (13.7 kDa), respectively.

