Figure 3.
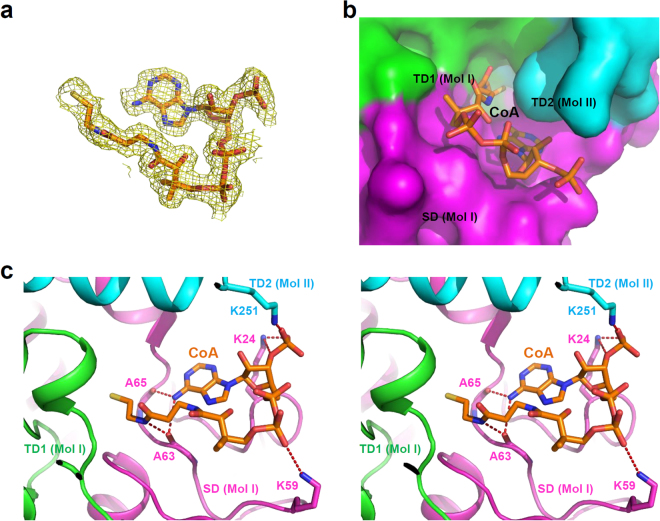
CoA binding mode of Ms3HPCD. (a) Electron density map of CoA. The Fo-Fc electron density map of the bound CoA is shown as a yellow colored mesh and contoured at 3 σ. The CoA molecule is shown as a stick model with an orange color. (b) A surface model of the active site of Ms3HPCD. The Ms3HPCD structure is shown as a surface model. Three domains are distinguished with different colors of magenta, green, and cyan for the SD, TD1, and TD2, respectively, and labeled appropriately. The bound CoA is presented with a stick model with an orange color. (c) Stereo-view of the CoA binding mode of Ms3HPCD. The Ms3HPCD structure complexed with CoA is presented with a cartoon diagram with the same color scheme as in (b). The residues involved in the CoA binding are shown as a stick model and labeled. The hydrogen bonds involved in the CoA binding are shown as red-colored dotted lines. The bound CoA is shown as a stick model with an orange color.

