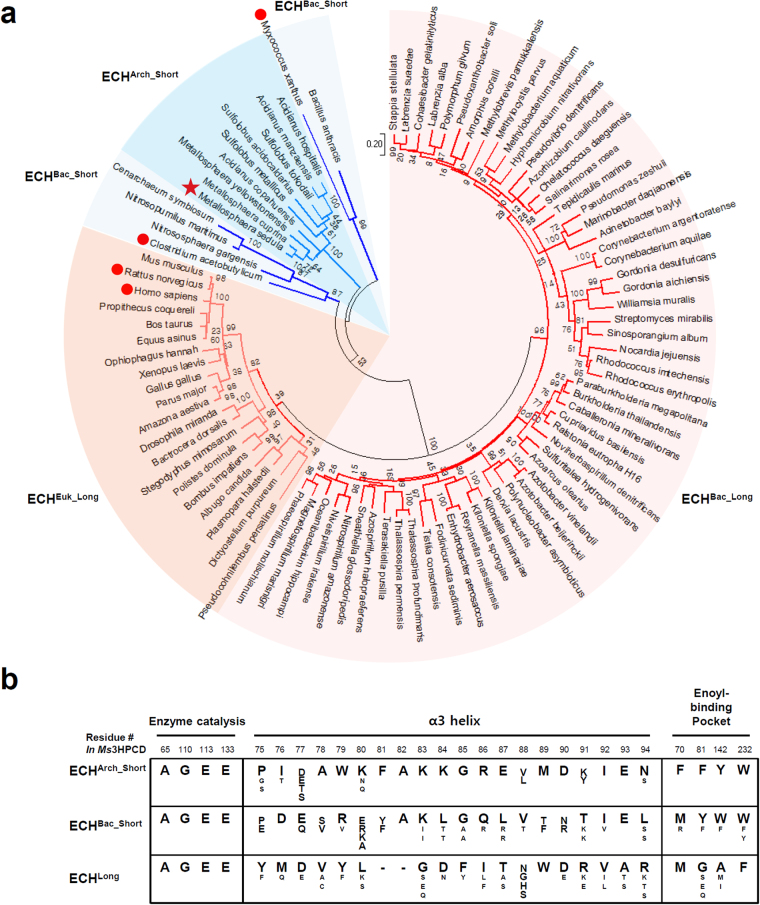
Figure 5.
Phylogenetic analysis of ECH enzymes. (a) Unrooted Maximum Likelihood tree of ECH enzymes. The phylogenetic tree is drawn as a circle model. Bootstrap values are shown at each node as percentage of 100 replicates. ECH subgroups are labeled and distinguished with different colors. Ms3HPCD is indicated by a star mark and the structures used for the comparison with Ms3HPCD are indicated by red colored dots. (b) Amino-acid sequence alignment of key residues in ECH enzymes. The key residues involved in the enzyme catalysis, α3 helix, and enoyl-binding pocket in ECHs are aligned.

