
Figure 2. Comparison of population proportions for the CREB3L1- and PTN-presenting patients.
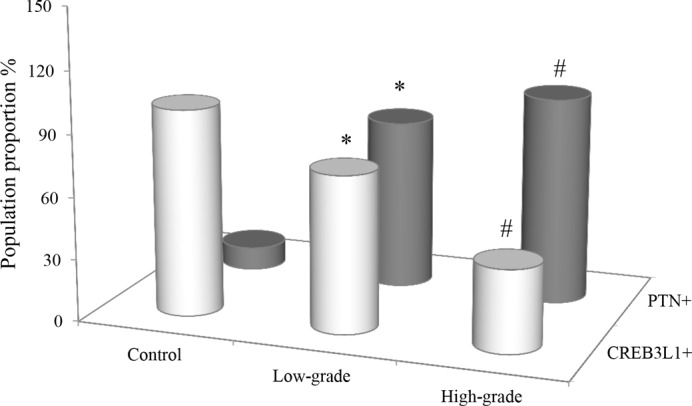
Population distribution for the CREB3L1- and PTN-presenting patients were expressed as a percentage of the control (n=9) and the cohorts with the low- (n=17) and high-grade (n=25) gliomas. χ2 test was used to observe the changes of the proportions with CREB3L1+ and PTN+. *: P-value of <0.05 compared with the control; #: P-value of <0.05 compared with either the control or the low-grade glioma.