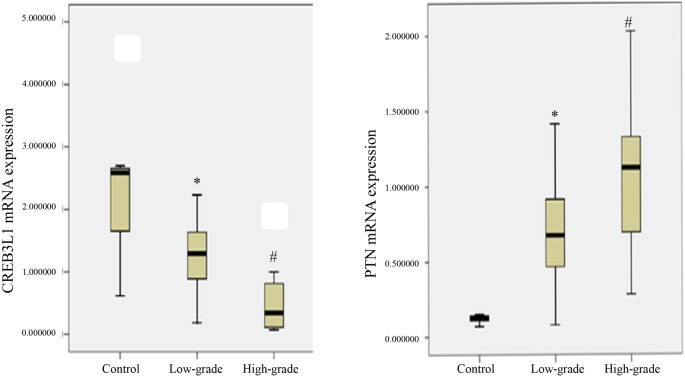
Figure 3. CREB3L1 and PTN mRNA expression levels.
CREB3L1 (left) and PTN (right) mRNA expression was examined in control, low- and high-grade glioma cells (n=5 in each group). The data were expressed as a fold change in the mRNA expression level of the individual tissues. The CREB3L1 and PTN mRNA levels were calculated in reference to the control mRNA level. The results were shown as median (IQR). *: P-value of <0.05 compared with the control. #: P-value of <0.05 compared with either the control or the low-grade glioma.

