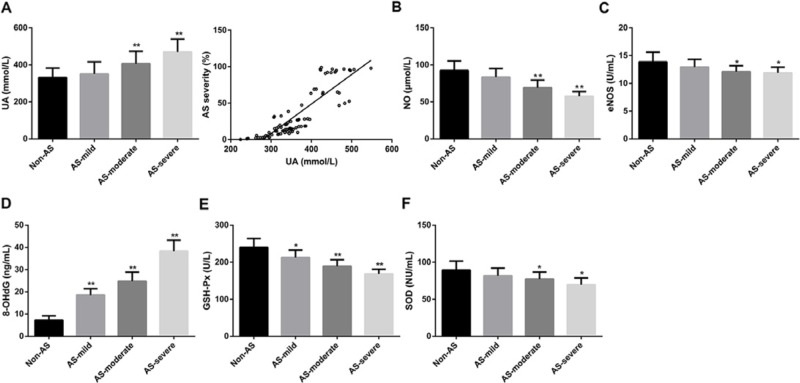
Figure 1. Increased UA concentration and enhanced oxidative stress in AS patients.
(A) The concentrations of UA in Non-AS, AS-mild, AS-moderate, and AS-severe groups and the correlation between UA concentration and AS severity. (B) The concentrations of NO in Non-AS, AS-mild, AS-moderate, and AS-severe groups. (C) The activities of eNOS in Non-AS, AS-mild, AS-moderate, and AS-severe groups. (D) The concentrations of 8-OHdG in Non-AS, AS-mild, AS-moderate, and AS-severe groups. (E) The activities of GSH-Px in Non-AS, AS-mild, AS-moderate, and AS-severe groups. (F) The activities of SOD in Non-AS, AS-mild, AS-moderate, and AS-severe groups. According to the CT examination results, CI patients were divided into two groups: AS and Non-AS group (n = 43 in each group). According to NASCCET classification, vascular atherosclerotic stenosis can be classified as: <29% for mild stenosis (AS-mild, n=15), 30–69% for moderate stenosis (AS-moderate, n=15), >90% for severe stenosis (AS-severe, n=13); *P<0.05 and **P<0.01 compared with Non-AS group.

