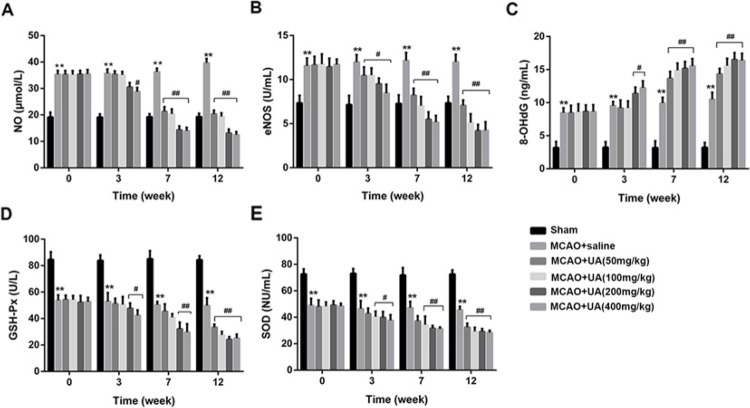
Figure 3. UA promotes oxidative stress in rats with MCAO.
(A) The concentration of UA in each group. (B) The activity of eNOS in each group. (C) The concentration of 8-OHdG in each group. (D) The activity of GSH-Px in each group. (E) The activity of SOD in each group. Rats were received an intragastric administration of UA at 50, 100, 150, and 200 mg/kg body weight twice one day for 12 weeks consecutively (n = 11 in each group). Rats treated with normal saline were used as the control group (MCAO + saline). **P<0.01 compared with Sham group. #P<0.5 and ##P<0.01 compared with MCAO + saline group.

