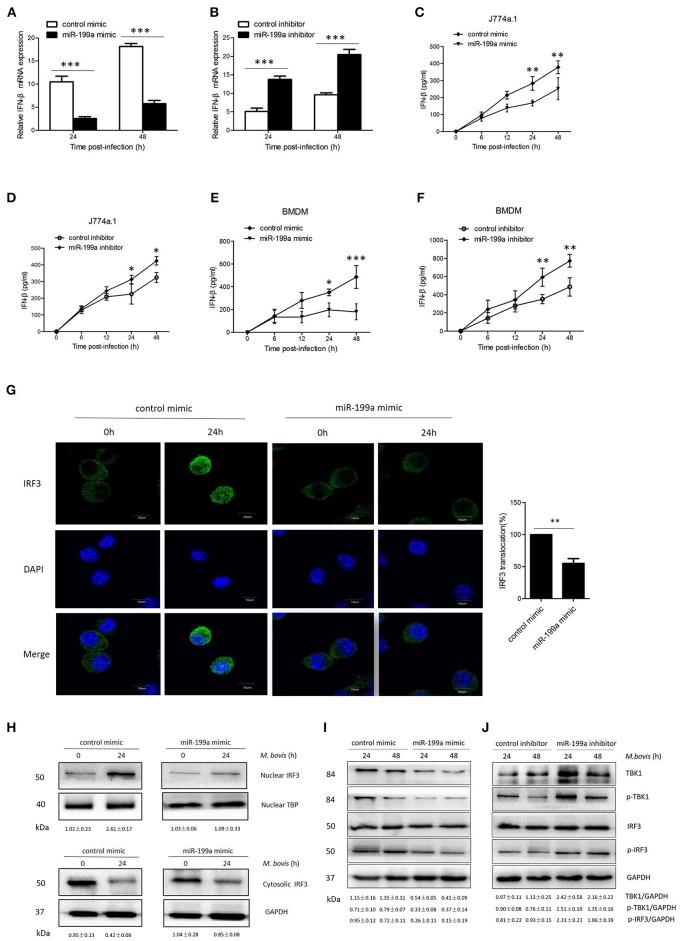
Figure 5.
miR-199a impairs interferon-β (IFN-β) production by inhibiting TANK-binding kinase 1 (TBK1)-dependent pathway. J774a.1 cells were treated with miR-199a mimic or inhibitor for 24 h, and then infected with Mycobacterium bovis (M. bovis) at a MOI of 10 for the indicated time. mRNA levels of IFN-β (A,B) were determined by Quantitative Real-Time PCR. J774a.1 cells and mouse bone marrow monocyte-derived macrophages (BMDMs) were treated with miR-199a mimic or inhibitor for 24 h, followed by M. bovis infection at a MOI of 10 for the indicated time. IFN-β production (C–F) was measured by ELISA assay. (G) Immunofluorescence staining of IRF3 (green) of J774a.1 cells infected with M. bovis at a MOI of 10 for 0 or 24 h. The proportion of nuclear IRF3 is shown (right). Cell nuclei were dyed with DAPI (blue). Approximately 20 cells were used to calculate the IRF3 nuclear translocation proportion. Image J software was used for the analysis. (H) J774A.1 cells were infected with M. bovis at a MOI of 10 for 0 or 24 h. Nuclear and cytosolic extracts were examined by immunoblotting with anti-IRF3 antibody at different infection times (4, 24 h). These membranes were stripped and immunoblotted with anti-β-actin and anti-TATA binding protein (TBP) antibodies to examine the purity of nuclear (right) and cytoplasmic (left) lysates. The IRF3/β-actin and IRF3/β-actin ratios are shown below. (I, J) J774a.1 cells were treated with control, miR-199a mimic or inhibitor and then infected with M. bovis at a MOI of 10 for 24 or 48 h. Quantitative analysis of the TBK1, phosphorylated TBK1 (p-TBK1), IRF3 and phosphorylated IRF3 (p-IRF3) bands normalized to GAPDH is shown. Data is presented as mean ± SD in three independent experiments (*P < 0.05; **P < 0.01; ***P < 0.001).

