FIGURE 1.
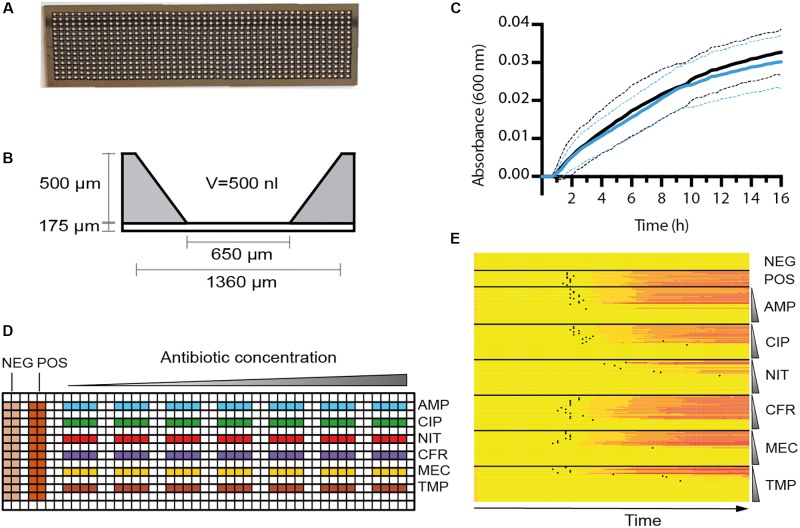
Characterization of the nwSlide as an AST platform. (A) Photograph of a nwSlide (25 mm × 75 mm) holding 672 nanowells in a 14 × 48 matrix. (B) Side view of one nanowell with dimensions and volume (V) indicated. (C) Growth measured at OD600 of a wt Escherichia coli laboratory strain (W3110, black) and a strain with mutated fnr gene (BW25113Δfnr, blue) in a nwSlide. Circa 200 nanowells were recorded for each strain, dashed lines = SD, n = 3. (D) The design of functionalized nwSlides used for nwASTs. The left side offers 24 non-functionalized nanowells each for negative (NEG., medium only) and positive (POS., inoculated medium) controls of bacterial growth. The antibiotics ampicillin (blue, AMP), ciprofloxacin (green, CIP), nitrofurantoin (red, NIT), cefadroxil (purple, CFR), mecillinam (yellow, MEC), and trimethoprim (brown, TMP) are coated and distributed in separate rows. The antibiotic concentration varies from lowest (left) to highest (right) as indicated schematically above the nwSlide. Each antibiotic is represented by seven twofold dilutions. Each concentration includes four nanowells that serve as technical replicates. Antibiotic concentrations in individual experiments are defined in Section “Materials and Methods.” (E) MIC determination of the reference strain E. coli ATCC 25922 from one nwAST functionalized as in (D). The heatmap shows OD600 recordings in each of the 216 nanocultures over 12 h at indicated conditions. A color change from yellow (low OD600) to red (high OD600) in one row indicates bacterial growth in the corresponding nanowell. Negative and positive controls include 24 wells each. For each antibiotic, growth pattern of the 28 nanocultures at 7 antibiotic concentrations is shown. The vertical gradient symbol indicates that nanocultures in the upper rows are exposed to the lowest concentration of antibiotics, whereas a gradual increase leaves the lower rows representing nanowells exposed to the highest concentration. Black dots represent the Tlag of each nanoculture.

